20 Digital Analytics Metrics: Categories, CRO and KPIs
Digital analytics metrics are measurement data points that connect user behavior, acquisition quality, engagement depth, conversion progress, retention patterns and revenue outcomes across websites, apps and campaigns. This list groups the 20 core KPIs by decision area so reporting stays tied to growth, CRO and customer experience.
The main digital analytics metrics to track are grouped by acquisition, engagement, behavior, conversion, retention and revenue below. Each metric card gives a definition, a measurement use and a caution for interpretation.
Why do digital analytics metrics matter for growth, CRO and customer experience?
Digital analytics metrics matter because they connect user behavior to growth decisions, CRO priorities and customer experience improvements across every measurable digital touchpoint. They turn sessions, events, traffic sources and conversions into decision data for budget allocation, UX fixes, campaign evaluation and KPI reporting.
Metrics create a shared measurement language across marketing, product and analytics teams. Acquisition indicators show where qualified visits come from. Engagement indicators show whether the experience holds attention. Conversion and revenue indicators show where outcomes, costs and lifetime value move together.
- Growth: traffic source, users, sessions, customer acquisition cost and customer lifetime value show channel quality.
- CRO: conversion rate, funnel drop-off, form completion and checkout abandonment identify test priorities.
- Customer experience: scroll depth, exit rate, friction signals, retention and churn reveal journey quality.
What are digital analytics metrics?
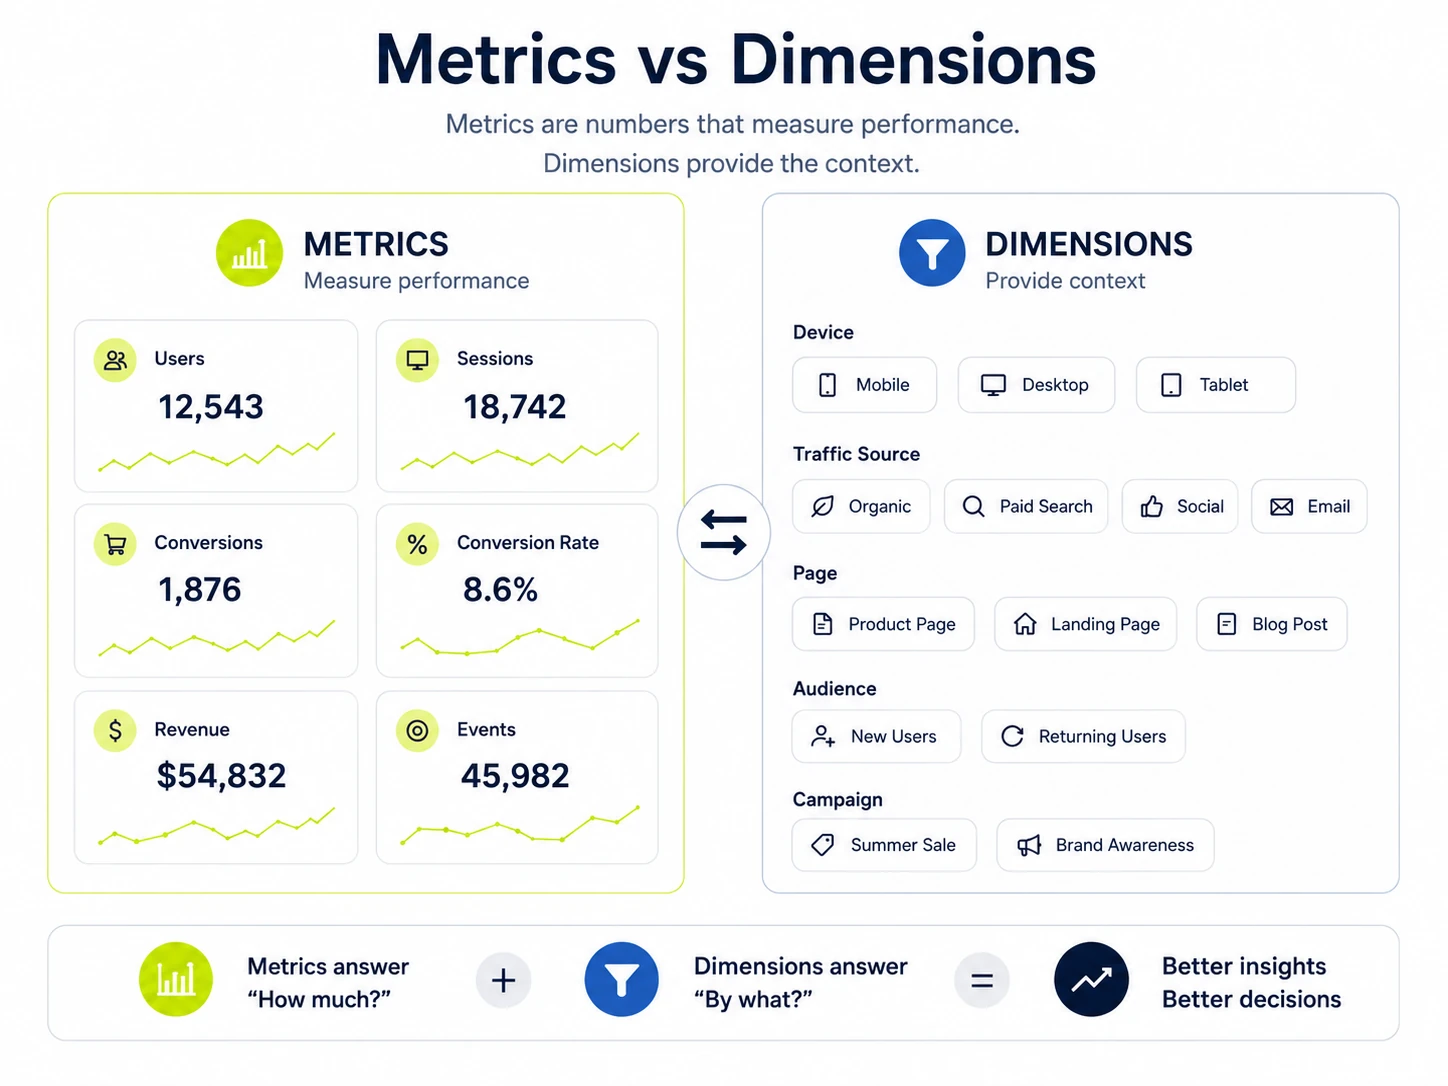
Digital analytics metrics are structured measurements used to evaluate digital behavior, marketing performance and business outcomes across websites, apps, campaigns and product experiences. They include numeric values such as users, sessions, conversions, retention, revenue and event counts, plus dimensions that explain source, device, page or cohort context.
How do digital analytics metrics differ from web analytics metrics and marketing analytics metrics?
Digital analytics metrics, web analytics metrics and marketing analytics metrics differ by scope, data source and decision use. Web analytics focuses on website behavior. Marketing analytics focuses on channel and campaign performance. Digital analytics covers both areas plus app, product, ecommerce and customer experience measurement.
| Analytics type | Scope | Common metrics | Primary use |
|---|---|---|---|
| Digital analytics | Websites, apps, campaigns, products and customer touchpoints | Users, events, conversions, retention, revenue and friction signals | Evaluate the full digital journey |
| Web analytics | Website visits and on-site behavior | Sessions, pageviews, traffic source, exit rate and engagement rate | Assess site performance and browsing behavior |
| Marketing analytics | Channels, campaigns and media spend | CTR, CPC, CPA, ROAS, CAC and conversions | Assess campaign efficiency and budget allocation |
How do you choose the right digital analytics metrics?
The right digital analytics metrics are chosen by matching each KPI to a business goal, journey stage, data owner and decision cadence. A metric belongs in the report only when it changes a marketing, UX, product or revenue decision within a defined time period.
Use the checklist below to choose metrics that support decisions instead of vanity reporting.
- Define the goal: acquisition, engagement, conversion, retention, revenue or experience quality.
- Select the user journey stage: visit, interaction, action, repeat usage or purchase.
- Assign the owner: marketing, product, CRO, ecommerce, analytics or leadership.
- Set the segment: channel, device, page, campaign, cohort, geography or customer type.
- Compare against a target, benchmark or previous period.
Which acquisition metrics belong in a digital analytics report?
Acquisition metrics show how users find a digital property and which channels create qualified visits, leads or customers. This section covers users, sessions, traffic source and click-through rate because they explain reach, visit volume, channel origin and pre-visit response quality.
The key metrics in this category are listed below.
1. Users
Users count distinct people, browser-client identities or active visitors recorded during a selected date range. The metric measures audience reach, separates new and returning visitors and gives context for conversion rate, retention analysis and cohort reporting.
- Use this metric when evaluating audience size, campaign reach or product adoption.
- Formula: count of unique user identifiers in the selected period.
- Caution: identity rules vary by platform, consent state and device behavior.
2. Sessions
Sessions count visits or interaction periods that begin when a user opens a website or app and end after inactivity, campaign reset rules, or platform-specific session logic. The metric measures visit volume and gives context for engagement, conversion rate and traffic source analysis.
- Use this metric when evaluating visit quality, landing page performance or channel demand.
- Formula: count of recorded session starts in the selected period.
- Caution: one user often creates multiple sessions, so sessions and users answer different questions.
3. Traffic source
Traffic source identifies where a visit originates, such as organic search, paid search, referral, direct, email or social media. The metric connects acquisition volume to channel attribution and shows which sources create qualified sessions, conversions and revenue.
- Use this metric when evaluating channel mix, campaign quality or media allocation.
- Formula: visits or conversions grouped by source, medium or channel dimension.
- Caution: missing UTMs and referral exclusions distort source reporting.
4. Click-through rate
Click-through rate measures the percentage of impressions that produce clicks on a search result, ad, email link, CTA or listing. CTR connects exposure to action and shows whether a message earns a response before the user reaches the website or app.
- Use this metric when evaluating ad copy, SERP snippets, email links or CTAs.
- Formula: clicks divided by impressions multiplied by 100.
- Caution: high CTR with weak conversion rate signals traffic-quality mismatch.
Which engagement metrics belong in a digital analytics report?
Engagement metrics show whether users interact meaningfully with a website, app, content asset or product experience after arrival. This section covers engagement rate, average session duration, pages per session and key events because they explain attention, depth and meaningful interaction quality.
The key metrics in this category are listed below.
5. Engagement rate
Engagement rate measures the share of sessions or users that meet a defined interaction threshold, such as active time, multiple page views, a key event or another platform rule. The metric separates passive visits from sessions with measurable involvement.
- Use this metric when evaluating content relevance, landing page quality or audience interest.
- Formula: engaged sessions divided by total sessions multiplied by 100.
- Caution: platform definitions differ, so define engagement before comparing reports.
6. Average session duration
Average session duration measures the average time users spend during a session. The metric indicates content fit and journey depth when interpreted with engagement rate, page type, traffic source and conversion behavior rather than as a standalone quality score.
- Use this metric when evaluating content depth, product browsing or assisted conversion paths.
- Formula: total session duration divided by total sessions.
- Caution: short sessions often signal fast task completion on support, pricing or contact pages.
7. Pages per session
Pages per session measures the average number of pages viewed during one visit. The metric shows browsing depth, internal-link use and content discovery when interpreted with session intent, page type and conversion outcome.
- Use this metric when evaluating navigation, content clusters or discovery paths.
- Formula: pageviews divided by sessions.
- Caution: more pages per session is positive only when deeper browsing supports the user goal.
8. Event count or key events
Event count records how many times tracked interactions occur, while key events mark the interactions tied to business goals. Together they show user actions such as form starts, downloads, video plays, CTA clicks, signups and purchases.
- Use this metric when evaluating interaction quality, micro-conversions or goal progress.
- Formula: count of event occurrences or key event occurrences.
- Caution: duplicate event firing inflates engagement and conversion reporting.
Which behavior analytics metrics belong in a digital analytics report?
Behavior analytics metrics reveal how users move through digital experiences and where friction appears in the journey. This section covers scroll depth, exit rate and friction signals because these indicators explain content consumption, journey endings and interface problems.
The key metrics in this category are listed below.
9. Scroll depth
Scroll depth measures how far users move down a page, usually as a percentage of page length or a threshold event. The metric indicates content consumption, above-the-fold performance and whether users reach key blocks such as forms, CTAs or product information.
- Use this metric when evaluating long-form content, landing pages and page layout.
- Formula: page depth threshold reached by users or sessions.
- Caution: scroll depth shows movement, not comprehension or satisfaction.
10. Exit rate
Exit rate measures the percentage of pageviews or visits where a specific page is the last interaction before leaving the site. The metric identifies journey endings and supports funnel, content and landing page diagnosis.
- Use this metric when evaluating checkout steps, form pages, content exits or product detail pages.
- Formula: exits from a page divided by pageviews for that page multiplied by 100.
- Caution: high exit rate is normal on confirmation, contact and answer-completion pages.
11. Friction signals
Friction signals are behavior indicators that show user frustration or failed interaction, including rage clicks, dead clicks, repeated field errors, cursor thrashing and session replay anomalies. These signals identify interface points where users expect a response and receive none.
- Use this metric when evaluating UX defects, form problems, broken UI elements or slow components.
- Formula: count or rate of friction events by page, element or session.
- Caution: fast repeated clicks require context before classification as frustration.
Which conversion and CRO metrics belong in a digital analytics report?
Conversion and CRO metrics show whether users complete desired actions and where optimization changes improve results. This section covers conversion rate, funnel drop-off, form completion and cart or checkout abandonment because they connect behavior measurement to outcomes.
The key metrics in this category are listed below.
12. Conversion rate
Conversion rate measures the share of users, sessions or visits that complete a defined action, such as a purchase, lead form, signup or key event. The metric connects traffic quality, landing page clarity and CRO testing to measurable outcomes.
- Use this metric when evaluating goal completion, landing pages, campaigns or experiments.
- Formula: conversions divided by users or sessions multiplied by 100.
- Caution: define the denominator before comparing teams, channels or reports.
13. Funnel drop-off rate
Funnel drop-off rate measures the share of users who leave between one step and the next in a signup, checkout, lead or onboarding path. The metric identifies the exact journey step where conversion progress slows or stops.
- Use this metric when evaluating checkout, onboarding, trial signup or lead funnels.
- Formula: users lost between steps divided by users entering the previous step multiplied by 100.
- Caution: voluntary exit after task completion is not a funnel defect.
14. Form completion rate
Form completion rate measures the percentage of users who start and submit a form. The metric connects form design, field difficulty, error handling and lead-generation quality to completed inquiries, signups or applications.
- Use this metric when evaluating lead forms, demo requests, newsletter signups or application flows.
- Formula: form submissions divided by form starts multiplied by 100.
- Caution: submission count alone hides field-level abandonment and validation errors.
15. Cart or checkout abandonment rate
Cart or checkout abandonment rate measures the share of users who add products to a cart or enter checkout without completing a purchase. The metric connects ecommerce friction, pricing clarity, shipping cost, payment options and trust signals to lost revenue.
- Use this metric when evaluating ecommerce checkout, payment flow or cart recovery.
- Formula: abandoned carts or checkouts divided by initiated carts or checkouts multiplied by 100.
- Caution: compare abandonment by device, traffic source and product category before changing checkout design.
Which retention and customer metrics belong in a digital analytics report?
Retention and customer metrics show whether users return, stay active and keep creating value after the first interaction. This section covers returning users, customer retention rate and churn rate because they connect acquisition quality to repeat usage and long-term outcomes.
The key metrics in this category are listed below.
16. Returning users
Returning users measure people or browser-client identities recorded after a previous visit or interaction. The metric shows repeat interest, brand recall and product usefulness when paired with cohort period, traffic source and conversion behavior.
- Use this metric when evaluating loyalty, content value, product habit or repeat demand.
- Formula: users with prior recorded activity in the selected property or cohort.
- Caution: cookie loss, consent changes and cross-device usage affect returning-user counts.
17. Customer retention rate
Customer retention rate measures the percentage of customers who remain active across a defined period. The metric connects onboarding quality, product value, customer experience and purchase satisfaction to repeat usage or repeat revenue.
- Use this metric when evaluating subscription, ecommerce, SaaS or membership performance.
- Formula: retained customers divided by customers at the start of the period multiplied by 100.
- Caution: define active customer status before comparing periods or cohorts.
18. Churn rate
Churn rate measures the percentage of customers, subscribers or active users lost during a period. The metric shows retention loss and exposes where acquisition volume fails to translate into durable customer value.
- Use this metric when evaluating recurring revenue, product adoption or customer experience risk.
- Formula: lost customers divided by customers at the start of the period multiplied by 100.
- Caution: voluntary pauses, seasonal cycles and billing changes require separate segments.
Which business and revenue metrics belong in a digital analytics report?
Business and revenue metrics connect digital behavior to acquisition efficiency, profitability and long-term customer value. This section covers customer acquisition cost and customer lifetime value because those KPIs turn channel, conversion and retention reporting into financial context.
The key metrics in this category are listed below.
19. Customer acquisition cost
Customer acquisition cost measures the average spend required to acquire one new customer. The metric connects advertising cost, campaign efficiency, conversion rate and sales qualification to profitability at the channel, campaign or cohort level.
- Use this metric when evaluating paid media, lead generation, campaign efficiency or sales handoff.
- Formula: acquisition spend divided by new customers acquired.
- Caution: CAC without CLV hides whether customers repay acquisition cost over time.
20. Customer lifetime value
Customer lifetime value estimates the revenue or gross profit a customer produces across the relationship period. The metric connects retention, purchase frequency, average order value and acquisition cost to long-term customer economics.
- Use this metric when evaluating acquisition quality, retention value, customer segments or budget limits.
- Formula: average purchase value multiplied by purchase frequency multiplied by customer lifespan, adjusted by margin when available.
- Caution: CLV projections require cohort validation because averages hide customer mix changes.
Which metrics match each digital analytics goal?
Digital analytics metrics become easier to choose when each KPI maps to the goal it supports. Goal mapping prevents broad reporting from replacing decisions and keeps every metric tied to a journey stage, segment and owner.
| Goal | Metrics to track | Decision supported |
|---|---|---|
|
Acquire qualified traffic |
Users, sessions, traffic source, CTR and CAC |
Channel and budget selection |
|
Improve engagement |
Engagement rate, average session duration, pages per session and event count |
Content and experience changes |
|
Reduce friction |
Scroll depth, exit rate, friction signals and funnel drop-off |
UX and CRO prioritization |
|
Increase conversion |
Conversion rate, form completion and checkout abandonment |
Test planning and funnel repair |
|
Improve retention |
Returning users, retention rate and churn rate |
Customer experience and product follow-up |
|
Protect profitability |
CAC, CLV, ROAS and revenue by source |
Budget limits and growth targets |
What formulas are required for digital analytics metrics?
Digital analytics metric formulas define how each KPI is calculated and prevent inconsistent reporting across dashboards, teams and time periods. Formula documentation also records the numerator, denominator, unit, segment and date range for each measurement.
| Metric | Formula | Interpretation |
|---|---|---|
| Conversion rate | Conversions divided by users or sessions multiplied by 100 | Goal completion efficiency |
| CTR | Clicks divided by impressions multiplied by 100 | Message or listing response |
| Pages per session | Pageviews divided by sessions | Browsing depth |
| Form completion rate | Form submissions divided by form starts multiplied by 100 | Lead flow completion |
| Checkout abandonment rate | Abandoned checkouts divided by started checkouts multiplied by 100 | Purchase friction |
| Retention rate | Retained customers divided by starting customers multiplied by 100 | Repeat customer continuity |
| Churn rate | Lost customers divided by starting customers multiplied by 100 | Customer loss |
| CAC | Acquisition spend divided by new customers | Acquisition efficiency |
Which tools track digital analytics metrics?
Digital analytics metrics are tracked with analytics platforms, product analytics systems, behavior analytics tools, tag management platforms, ad platforms, CRM data and reporting dashboards. Tool selection depends on the metric category, data source, event schema and reporting owner.
| Tool category | Metrics captured | Common use |
|---|---|---|
| Web analytics | Users, sessions, traffic source, engagement rate, key events and revenue | Website and app reporting |
| Product analytics | Activation, feature adoption, cohorts, retention and event paths | Product journey analysis |
| Behavior analytics | Scroll depth, heatmaps, session replay, rage clicks and dead clicks | UX friction diagnosis |
| Tag management | Event tracking, parameters, conversion tags and data layer values | Measurement deployment |
| Ad platforms | Impressions, clicks, cost, conversions and ROAS | Campaign performance |
| BI and dashboards | Segmented KPI views, trend lines and scorecards | Reporting and decision review |
How are digital analytics metrics reported?
Digital analytics metrics are reported by audience, goal, segment and time period so each dashboard supports a clear decision. A report groups KPIs by owner, shows the target or benchmark and separates diagnostic metrics from outcome metrics.
A practical reporting structure is shown below.
- Segment reports by channel, device, campaign, page, geography and cohort.
- Separate raw counts from rates so volume changes do not hide efficiency changes.
- Record each metric definition beside the dashboard or in a measurement dictionary.
| Audience | Primary view | Metrics |
|---|---|---|
| Leadership | Scorecard | Revenue, CAC, CLV, conversion rate and retention |
| Marketing | Channel dashboard | Traffic source, CTR, cost, conversions and CAC |
| CRO | Funnel view | Conversion rate, drop-off, form completion and checkout abandonment |
| Product | Cohort and event view | Active users, key events, retention and feature usage |
| UX | Behavior view | Scroll depth, exit rate, rage clicks and session replay findings |
What mistakes create unreliable digital analytics metrics?
The most common digital analytics mistakes happen when metrics are tracked without clear definitions, reliable data or a decision-making purpose. These mistakes create reporting disagreement, inflated performance signals and CRO decisions based on incomplete user behavior.
Avoid the following mistakes when using digital analytics metrics.
- Tracking KPIs without a hypothesis or measurement owner.
- Comparing reports that use different attribution models.
- Leaving bot traffic and internal traffic inside performance views.
- Reading short-term performance changes without seasonality context.
- Missing key conversion events or duplicating event triggers.
- Reporting averages without segments, cohorts or page-level context.
- Using inconsistent metric definitions across dashboard users.
- Optimizing short-term conversion lift while retention or CLV declines.
Is each metric tied to a clear hypothesis?
YES. Each metric requires a hypothesis that links the data point to an expected behavior or decision. A hypothesis turns reporting into a testable measurement plan and prevents dashboards from collecting unused numbers.
Are attribution models consistent across reports?
YES. Attribution models require consistency across dashboards that compare channels, campaigns or revenue. Mixed attribution rules change conversion credit and create false differences between marketing reports.
Is bot traffic or internal traffic filtered out?
YES. Bot traffic and internal visits require filtering before KPI review. Unfiltered activity inflates sessions, distorts engagement rate and creates false conversion paths from employees, vendors or automated crawlers.
Is seasonality considered when reading performance changes?
YES. Seasonality changes traffic, purchase behavior and engagement patterns across weeks, campaigns and holidays. Compare metrics against prior periods, same-season cohorts and campaign calendars before assigning causes.
Are important conversion events missing from tracking?
YES. Missing conversion events remove key actions from the measurement model. Form submits, purchases, calls, trial starts and qualified leads require event validation before conversion rate or CRO reporting.
Are averages checked against segments and cohorts?
YES. Averages require segment and cohort checks because mixed traffic often hides page, device, channel or customer differences. Segment views expose which audience group drives the reported change.
Are metric definitions consistent across dashboard users?
YES. Metric definitions require one shared measurement dictionary. Users, sessions, key events, conversions, revenue and retention create reporting conflict when teams apply different formulas or filters.
Do short-term conversion lifts hurt retention or CLV?
YES. Short-term conversion lifts reduce retention or CLV when a test increases low-quality signups, discount-driven purchases or poor-fit customers. Pair conversion rate with retention, churn and customer lifetime value.
Digital analytics metrics create a single measurement set for growth, CRO and customer experience when each KPI has a definition, formula, segment, target and decision owner. The same n-gram loop closes the article: acquisition quality, engagement depth, behavior signals, conversion progress, retention patterns and revenue outcomes stay connected.

Written by
Zunnun
GA4 consultant and GTM expert helping businesses fix broken tracking. Specializes in conversion tracking, marketing attribution and semantic SEO.
Free Analytics Audit
Is your tracking setup costing you revenue?