Digital Analytics: Definition, Benefits and Tools
Digital analytics is the process of collecting and analyzing online user data to understand performance, improve marketing and support better business decisions across websites, apps, campaigns and ecommerce journeys through analytics tools, metrics, reports, implementation workflows, retention measurement and governance.
It differs from general data analytics by focusing on digital sources: website traffic, user behavior, conversion rate, campaign performance, product events and customer retention. A complete digital measurement program connects data collection, reports, examples, strategy, implementation, tool selection, platform governance and analyst skills to business outcomes such as lower acquisition waste, clearer channel attribution and stronger repeat purchase behavior.
What Is Digital Analytics?
Digital analytics is the measurement discipline that collects, organizes and analyzes digital source data from websites, apps, campaigns and customer touchpoints to explain user behavior, customer interactions, conversion rates and performance changes across digital experiences for reporting and optimization workflows. Digital measurement covers sessions, events, users, traffic sources, devices, content engagement, product actions and revenue signals. Web analytics is the website-focused subtype, while online analytics also covers app, ad, email, social and product activity.
How Is Digital Analytics Different From General Data Analytics?
Digital analytics differs from general data analytics because it studies online touchpoints, whereas data analytics covers broader datasets from sales, finance, operations, support, product usage and offline customer records across a business intelligence environment for operational analysis and planning workflows.
The main differences between digital analytics and general data analytics are:
- Scope: Digital analytics focuses exclusively on online touchpoints (websites, apps, ads, emails), while general data analytics includes offline data such as in-store sales, supply chain records and call center logs.
- Data sources: Digital analytics relies on tags, pixels, SDKs and APIs, whereas general data analytics pulls from databases, spreadsheets, ERP systems and CRM platforms.
- Speed: Digital analytics often delivers real-time or near-real-time insights, while general data analytics may work with daily, weekly or monthly batch data.
- User identity: Digital analytics frequently uses anonymous or pseudonymous identifiers (cookies, device IDs), while general data analytics often links directly to known customer or transaction records.
Why Is Digital Analytics Important?
Digital analytics is important because it turns online data into user behavior evidence, marketing ROI signals, customer experience findings, campaign performance diagnostics, conversion improvement targets and data-driven decisions linked to business goals across websites, apps and paid channels inside daily performance reports.
The main reasons digital analytics is important are:
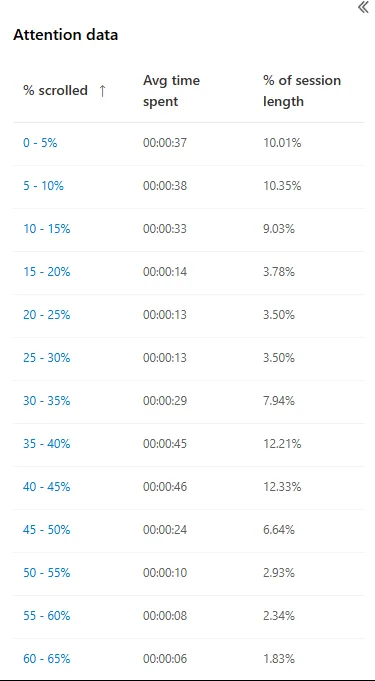
- User behavior: Page paths, feature use, scroll depth, search terms and drop-off points identify friction inside website and app journeys.
- Marketing ROI: Channel cost, assisted conversions, ROAS and customer acquisition cost connect campaign spend to revenue or lead quality.
- Customer experience: Rage clicks, slow pages, form errors and support-search patterns show where digital experiences break.
- Campaign performance: Source / medium, UTM parameters, CTR and landing page conversion rate separate strong channels from weak placements.
- Conversion improvement: Funnel analysis, A/B test results and key event paths identify pages, offers and forms that reduce completion.
- Data-driven decisions: Dashboards and summaries replace guesswork with repeatable evidence for budget, content and product work.
How Does Digital Analytics Support Digital Marketing?
Digital analytics supports digital marketing by showing campaign, channel and audience performance across search, paid media, email, social, referral and owned digital touchpoints linked to traffic quality, engagement, conversion rate and revenue contribution inside reporting workflows for weekly campaign decisions.
Marketing analytics connects channel data to customer responses, so budget, creative, landing pages and audience segments are judged by behavior rather than campaign labels.
Digital analytics supports digital marketing in the following ways:
- Campaign performance reports compare impressions, clicks, sessions, key events, revenue and ROAS by source.
- Audience behavior analysis shows device type, geography, returning users, landing pages and content paths.
- Channel attribution connects paid search, organic search, email, social, referral and direct visits to conversion outcomes.
- ROI measurement compares media cost, customer acquisition cost, lead quality and ecommerce revenue.
- Personalization analysis groups audiences by behavior, product interest, lifecycle stage and engagement depth.
- Strategy optimization uses tested findings from dashboards, funnel reports, experiments and campaign summaries.
What Are the Key Benefits of Digital Analytics?
The key benefits of digital analytics are stronger decision-making, clearer campaign visibility, improved customer experience, higher conversion quality and faster detection of performance changes across websites, mobile apps, ecommerce stores and digital marketing channels inside measurable reporting cycles for teams.
These benefits appear when collection rules, event definitions, data quality checks and dashboard ownership stay consistent across the martech stack.
The main benefits of digital analytics include:
- Decision-making improves because KPIs, segments and reports connect actions to business goals.
- Campaign performance becomes clearer through source / medium, UTM, ROAS and conversion rate analysis.
- Customer experience improves when friction points, broken forms, slow pages and confusing paths are identified.
- Conversion rates improve through funnel reports, key event paths, A/B test results and checkout analysis.
- Marketing strategy gains stronger evidence from audience cohorts, retention signals and channel contribution.
- Growth opportunities appear in high-intent pages, returning user segments, product demand and repeat purchase patterns.
What Data Does Digital Analytics Collect?
Digital analytics collects data that shows how users find, interact with, convert on and return to websites, apps, ads, ecommerce stores, product features and customer support touchpoints across the complete digital journey from acquisition through retention analysis and reporting cycles.
The main data types digital analytics collects are:
- Acquisition data: Traffic source, medium, campaign, keyword, referral path, landing page and new user volume.
- Engagement data: Page views, sessions, scroll depth, video_start events, content interactions and time-based engagement.
- Conversion data: Form_submit events, purchases, lead submissions, phone clicks, account sign-ups and key event values.
- Retention data: Returning users, cohort activity, repeat purchases, subscription renewals, churn risk and reactivation paths.
- Product usage data: Feature adoption, search queries, filter use, saved items, trial activation and logged-in behavior.
- Customer feedback data: Survey scores, support topics, sentiment tags, complaint themes and user research notes.
- Campaign data: Impressions, clicks, CTR, cost, ROAS, UTM parameters, audience segments and creative performance.
Which Digital Analytics Metrics Are Tracked?
Digital analytics metrics are tracked according to goals, with core measurement groups covering traffic volume, engagement rate, conversion rate, acquisition cost, customer lifetime value, retention rate, churn rate, click-through rate, bounce rate and campaign ROI inside recurring reports and dashboards.
The key digital analytics metrics to track are grouped below:
- Website and app traffic: Users, sessions, page views, active users, landing page entrances and device category.
- Engagement: Engagement rate, average engagement time, scroll events, video events, internal search and feature interactions.
- Conversion rate: Key event rate, lead rate, purchase rate, checkout completion and form completion.
- Customer acquisition cost: Media cost divided by acquired customers, qualified leads or first purchases.
- Customer lifetime value: Revenue, margin or subscription value attributed to a customer cohort over time.
- Retention and churn: Returning user rate, repeat purchase rate, cohort survival, subscription churn and inactivity signals.
- Click-through and bounce: CTR, ad engagement, organic result engagement, bounce rate and low-engagement landing pages.
- Campaign ROI: ROAS, revenue contribution, assisted conversions, channel profit and budget efficiency.
What Does a Digital Analytics Report Include?
A digital analytics report includes KPIs, traffic sources, user behavior, conversion funnels, data quality notes, business interpretation and recommendations that connect performance data to goals, owners and next actions for marketing, product and ecommerce teams inside each reporting period summary.
A complete digital analytics report includes the following sections:
- Executive summary: The main change in traffic, conversions, revenue, retention or customer experience.
- Goals and KPIs: The target metrics, segment definitions, measurement period and business owner for each KPI.
- Traffic sources: Channel, source / medium, campaign, landing page, device and geography performance.
- User behavior: Paths, events, scroll depth, product views, search use and content engagement patterns.
- Conversion funnels: Entry pages, drop-off points, key events, cart steps, checkout steps and form completion.
- Data quality notes: Tracking gaps, duplicate events, consent signal issues, missing UTM parameters, data freshness and filter changes.
- Insights: Evidence-backed findings that explain movement in KPIs, segments and customer journeys.
- Recommendations: Specific actions for tracking fixes, landing page changes, campaign tests and dashboard updates.
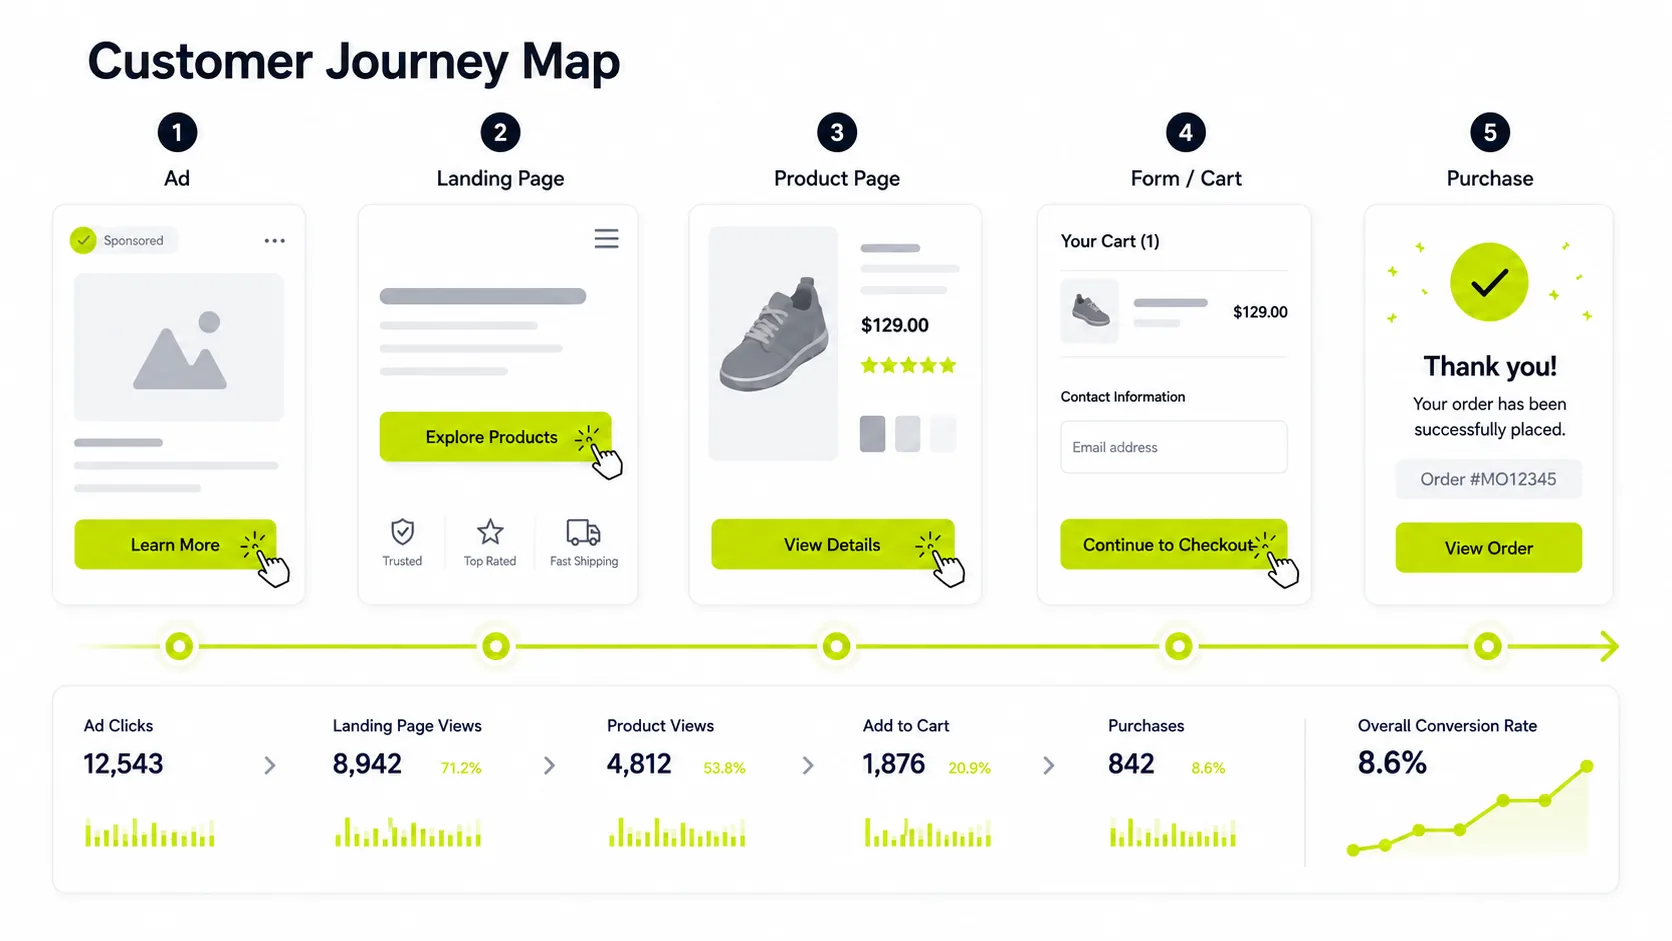
What Are Examples of Digital Analytics?
Digital analytics examples include measurable data points that show how people interact with websites, apps, ads, product pages, forms, checkout flows, email campaigns and other online channels from first visit through conversion and repeat engagement analysis in dashboards and reports.
Common examples of digital analytics include:
- Website traffic: Landing page, source / medium, device and geography data shows which entry points attract users, which channels bring qualified sessions and which locations or devices create low-engagement visits.
- Content engagement: Page views, scroll depth, bounce rate, average engagement time and exits show whether visitors read content, skip sections, leave quickly or continue into product and conversion paths.
- Interaction clicks: Navigation clicks, call-to-action clicks, product filter use, downloads and internal search results show which interface elements guide users toward deeper browsing or higher-intent actions.
- Ecommerce events: Product page views, add_to_cart events, checkout steps, purchase events and revenue show merchandising demand, cart friction, payment drop-off and sales performance by item or category.
- Ad engagement: Impressions, CTR, sessions, conversion rate and ROAS show whether paid media reaches the right audience, creates qualified traffic and produces revenue or leads after the click.
- Email measurement: Campaign sessions, form submissions, unsubscribe signals and returning user behavior show which sends create repeat visits, lead submissions, purchases or disengagement after subscribers reach the site.
- Conversion outcomes: Sales and lead conversions tied to campaign source, audience segment and funnel path show which acquisition routes, landing pages and audience groups produce completed actions.
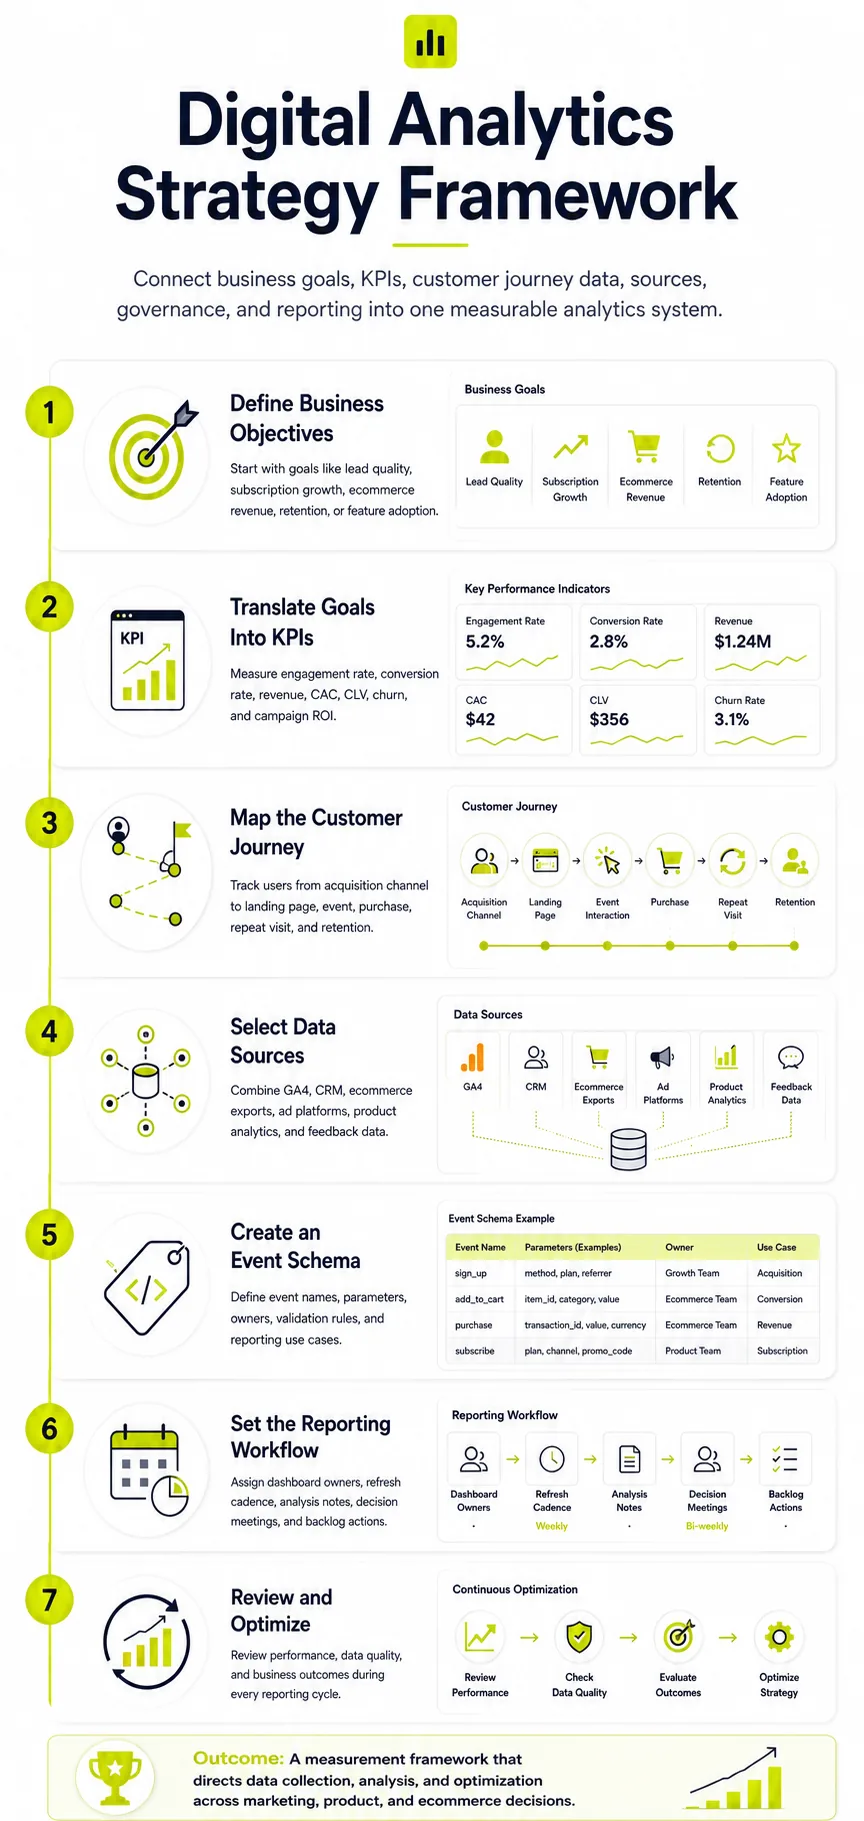
How Is a Digital Analytics Strategy Built?
A digital analytics strategy is built by connecting business objectives, KPIs, customer journey data, data sources, governance, ownership and reporting workflows into one measurement framework that directs collection, analysis and optimization priorities across marketing, product and ecommerce decisions over time.
The main steps to build a digital analytics strategy are:
- Define the business objective, such as lead quality, subscription growth, ecommerce revenue, retention or feature adoption.
- Translate the objective into KPIs, including engagement rate, conversion rate, revenue, CAC, CLV, churn and campaign ROI.
- Map the customer journey from acquisition channel to landing page, event, key event, purchase, repeat visit and retention signal.
- Select data sources such as GA4, CRM records, ecommerce platform exports, ad platforms, product analytics and customer feedback.
- Create an event schema with event names, parameters, owners, validation rules and reporting use cases.
- Set the reporting workflow, including dashboard owners, refresh cadence, analysis notes, decision meetings and backlog actions.
- Review performance, data quality and business outcomes during each reporting cycle.
How Is Digital Analytics Implemented?
Digital analytics implementation involves defining measurement goals, selecting an analytics stack, instrumenting event tracking, validating data accuracy and building dashboards that turn raw user behavior, campaign and conversion data into usable reporting workflows for monthly business review and optimization cycles.
The main steps to implement digital analytics are:
- Define measurement goals, KPI names, data owners, reporting users and business questions before any tag setup, so every event connects to a documented decision or dashboard field.
- Choose the analytics stack, including GA4, GTM, product analytics, BigQuery, Looker Studio or Adobe Analytics, based on event volume, integrations, data retention and reporting access.
- Create a tracking plan with event names, parameters, trigger rules, data layer fields and consent signals, then map each item to a KPI, platform destination and validation method.
- Instrument events through GTM tags, SDK events, server-side tagging, ecommerce platform integrations or direct code, with naming conventions, trigger conditions and parameter values documented for QA.
- Validate tracking accuracy with DebugView, Tag Assistant, Realtime reports, test transactions and data layer inspection, then compare browser events against platform reports for duplicates or missing fields.
- Build dashboards that show traffic sources, engagement, conversions, revenue, retention and data quality warnings, with filters, segments, date ranges and annotations aligned to reporting users.
- Assign reporting ownership, review cadence, issue logs and change control for tracking updates, so future site releases, campaign launches and consent changes stay visible in the measurement record.
What Are Digital Analytics Tools?
Digital analytics tools are software platforms that collect, measure and analyze user behavior data from websites, mobile apps, marketing campaigns and digital channels, then present conversion rates, journeys, audiences, dashboards and reports for analysis workflows across teams inside marketing operations.
Common types of digital analytics tools are:
Google analytics 4: Google's analytics platform records web and app events, traffic sources, audiences, ecommerce activity, attribution paths and key events inside one property. GA4 reports connect acquisition, engagement, monetization and retention data to marketing and product analysis.
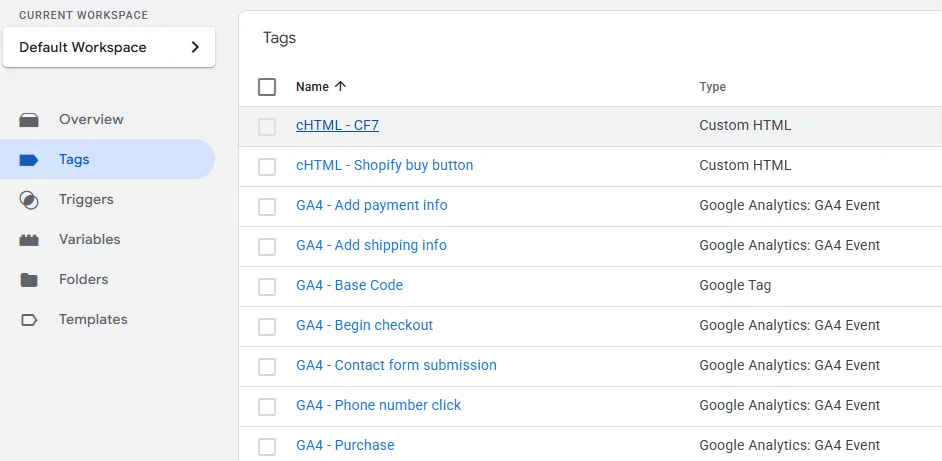
Google Tag Manager: GTM deploys tracking tags, triggers and variables through a container. The tag management platform separates measurement changes from site code and documents firing logic for GA4 events, ad pixels, conversion tags and consent signals.
BigQuery: BigQuery stores raw GA4 export tables for query-level analysis, joins with CRM or ecommerce records and longer retention windows. Analysts use SQL to inspect event parameters, users, sessions, revenue, attribution paths and data quality issues.
Looker Studio: Looker Studio turns GA4, Search Console, Google Ads, BigQuery and spreadsheet data into dashboards. Reports show KPIs, traffic sources, conversion funnels, channel performance and notes for recurring business reviews.
Adobe Analytics: Adobe Analytics supports enterprise web and app measurement through dimensions, metrics, segments, calculated metrics and Analysis Workspace projects. The platform fits organizations with complex report suites, merchandising variables and governed analyst workflows.
Amplitude: Amplitude focuses on product analytics, including funnels, cohorts, retention, feature usage, behavioral paths and experimentation. Product teams use it to measure activation, adoption, engagement depth and lifecycle movement.
Mixpanel: Mixpanel tracks event-based product and marketing activity through funnels, retention reports, cohorts, user profiles and impact analysis. It fits logged-in products with defined events, account identifiers and feature-level measurement.
Heap: Heap captures product interactions and organizes them into events after collection. The platform supports retroactive analysis, funnel review, session context and feature adoption reporting when event planning has gaps.
Microsoft Clarity: Microsoft Clarity adds heatmaps, session recordings, rage click detection and scroll behavior to web analytics. Experience teams use it to inspect friction behind metrics such as bounce rate, form drop-off and low engagement.
How Is the Right Digital Analytics Platform Chosen?
Choosing the right digital analytics platform starts with matching platform capabilities to business goals, tracking requirements, integration needs, privacy obligations, reporting depth, team skills and total cost across the analytics stack before implementation work begins for production measurement and reporting.
The main factors to consider when choosing a digital analytics platform are:
- Business goals: Revenue reporting, lead quality, retention, product adoption, content performance or campaign ROI.
- Tracking requirements: Web events, app events, ecommerce events, server-side events, offline imports and cross-domain paths.
- Integration capabilities: Google Ads, Search Console, CRM, ecommerce platforms, data warehouses, BI tools and customer data platforms.
- Performance scale: Event volume, user volume, query speed, dashboard refresh, data retention and export access.
- Data privacy and compliance: Consent signals, IP handling, regional storage, user deletion, role access and audit records.
- Ease of use: Analyst setup, marketer reporting, developer workload, naming governance and documentation depth.
- Reporting features: Funnel reports, cohort reports, attribution, custom segments, calculated metrics and dashboard connectors.
- Total cost: License fees, implementation hours, data warehouse cost, maintenance workload and training time.
Which Product Analytics Tools Are Used for Digital Analytics?
Product analytics tools used for digital analytics include platforms that track user behavior, funnel movement, retention cohorts, feature usage, product friction and customer journeys across logged-in applications and ecommerce experiences for product and marketing analysis inside dashboard and report workflows.
Common product analytics tools used for digital analytics are:
- Amplitude tracks funnels, cohorts, retention, paths, feature adoption and experiment outcomes.
- Mixpanel tracks event streams, user profiles, funnels, retention reports and cohort behavior.
- Heap captures interactions for retroactive event definition, journey analysis and adoption reports.
- Pendo combines product usage analytics, in-app guides, feedback and account-level product engagement.
- PostHog combines product analytics, feature flags, session replay, experiments and event pipelines.
- Fullstory records session replay, digital experience signals, frustration events and funnel context.
- Google Analytics tracks web and app engagement, ecommerce events, campaign sources and conversion paths.
- Adobe Analytics tracks enterprise web, app, campaign and merchandising behavior through governed report suites.
How Do SEO, Social and Customer Research Tools Support Digital Analytics?
SEO, social and customer research tools support digital analytics by adding keyword performance, audience engagement, sentiment, content demand, search visibility and customer feedback data to campaign, traffic source and customer behavior analysis across recurring digital marketing reports and decision workflows.
Search tools connect queries, rankings, impressions and click-through data to landing page performance. Social tools connect engagement, reach, audience response and creative performance to campaign analysis. Customer research tools connect survey themes, support topics and sentiment to experience diagnostics and content decisions.
Is Google Analytics a Digital Analytics Tool?
Yes, Google Analytics is a digital analytics tool used to collect and analyze website traffic, app data, user behavior, conversion tracking, campaign performance, audiences and ecommerce events inside a GA4 property for reporting and measurement governance across owned digital channels.
GA4 records events such as page_view, scroll, form_submit, purchase and video_start, then organizes them into acquisition, engagement, monetization and retention reports.
What Skills Are Used in Digital Analytics Work?
Digital analytics work requires technical, analytical, marketing and communication skills that connect SQL queries, Excel analysis, data visualization, statistical reasoning, Google Analytics configuration and business interpretation into repeatable measurement decisions for campaigns, products and customer journeys inside organizations and teams.
The main skills used in digital analytics work are:
- SQL for querying event tables, joining datasets and validating export records.
- Excel or spreadsheet analysis for calculations, QA checks, pivot tables and report preparation.
- Data visualization for dashboards, charts, segments, annotations and KPI monitoring.
- Statistical analysis for tests, cohorts, confidence intervals, outliers and trend interpretation.
- Google Analytics configuration for events, key events, audiences, attribution and data streams.
- GTM knowledge for tags, triggers, variables, data layer fields and consent signals.
- Marketing analysis for channel performance, campaign tracking, creative tests and conversion paths.
- Communication for explaining metric definitions, tradeoffs, data gaps and recommended actions.
Does Digital Analytics Improve Conversion Rates?
Yes, digital analytics improves conversion rates by showing where users drop off, which actions precede conversions, which pages create friction and which tests change completion rates across funnels, forms, checkouts and product journeys during conversion rate optimization analysis and testing workflows.
Funnel analysis identifies low-performing steps. A/B testing connects page changes to completion rates. Key event paths show which sources, content types and interactions occur before lead submissions, purchases or account creation.
Does Digital Analytics Measure Campaign Performance?
Yes, digital analytics measures campaign performance by tracking traffic, conversions, engagement, revenue, source / medium, UTM parameters, return on ad spend and landing page behavior for each marketing channel inside campaign dashboards, attribution reports, data validation checks and validated tagging records.
Campaign tracking links ad platform clicks to site sessions and key events. Attribution reports show channel contribution across paid search, organic search, social, email, display, referral and direct traffic.
Is Digital Analytics Useful for Ecommerce Websites?
Yes, digital analytics is useful for ecommerce websites because it shows how customers find products, view product detail pages, add items to carts, abandon checkout and complete purchases across the customer journey using sales tracking and conversion reports inside GA4.
Ecommerce analytics tracks item views, promotions, cart actions, checkout steps, payment events, purchase revenue, refunds and repeat orders. Product page performance, cart abandonment and sales tracking connect merchandising decisions to user behavior.
Does Digital Analytics Reduce Customer Churn?
Yes, digital analytics reduces customer churn by identifying behavior patterns that signal lower engagement, stalled feature usage, fewer repeat visits, support friction, subscription cancellation paths and declining retention before customers leave inside cohort and lifecycle reports for retention analysis workflows.
Cohort reports, retention rate, repeat purchase events and lifecycle segments close the measurement loop by connecting user behavior, campaign performance, conversion rate, analytics tools and business decisions back to the same online user data collected at the start of the program.

Written by
Zunnun
GA4 consultant and GTM expert helping businesses fix broken tracking. Specializes in conversion tracking, marketing attribution and semantic SEO.
Free Analytics Audit
Is your tracking setup costing you revenue?