Conversion Rate Optimization: Digital Analytics, Testing and Funnels
Conversion rate optimization uses digital analytics, funnel measurement and controlled testing to improve business outcomes from existing website traffic by defining conversion goals, finding drop-off points, segmenting users and validating page or funnel changes against measurable conversion, revenue and quality metrics.
Conversion rate optimization (CRO) is the process of improving the percentage of users or sessions that complete a desired action. Digital analytics is the measurement system that records traffic sources, audience segments, events, funnel steps and conversion outcomes for analysis.
CRO prioritization starts with data quality then moves from business outcome to funnel evidence and test design. The main CRO prioritization steps using digital analytics are listed below.
- Define the primary conversion goal and matching business outcome.
- Validate conversion tracking, traffic sources and event configuration.
- Measure funnel drop-off by step, device and source/medium.
- Compare audience segments by conversion value, CPA and quality.
- Rank opportunities by impact, confidence, effort and evidence strength.
- Write hypotheses tied to A/B testing and guardrail metrics.
- Run the test with sample size, duration and guardrail metrics.
- Report the result, segment impact and next recommendation.
What business outcome does conversion rate optimization improve?
A business outcome is the measurable commercial result improved through conversion rate optimization, such as qualified leads, purchases, revenue per visitor, demo requests or trial signups. CRO connects user actions, purchasing workflows, traffic quality and measurement data to one primary result.
CRO uses digital analytics, funnel evidence and controlled testing to increase the rate or value of desired actions without relying only on more traffic.
Common business outcomes improved by CRO are shown below.
| Business type | Primary CRO outcome | Supporting metric |
|---|---|---|
| Lead generation | Qualified lead submissions | Lead-to-opportunity rate |
| Ecommerce | Purchases from existing sessions | Revenue per visitor |
| SaaS | Demo requests or trial signups | Activation rate |
| Marketplace | Buyer or seller registrations | Customer acquisition cost |
| Subscription business | Paid customers | Trial-to-paid rate |
The selected outcome controls the primary conversion goal, the funnel measurement plan and the guardrail metrics used during testing.
What counts as a conversion for the website or funnel?
A website or funnel conversion is any measurable user action that matches a business goal, including a purchase, lead generation form submission, trial signup, booking request, checkout step completion or micro-conversion that signals progress toward a paying customer.
A funnel is the ordered path a user follows before the desired action. In ecommerce, conversion includes product-page engagement, add-to-cart actions, checkout progress and purchases. In SaaS and lead generation funnels, conversion includes demo requests, pricing clicks, form completions and qualified account creation. Common website and funnel conversions are shown below.
| Funnel type | Conversion example | Measurement event |
|---|---|---|
| Ecommerce | Completed purchase | purchase event with value and item parameters |
| Ecommerce | Checkout progress | begin_checkout and add_payment_info events |
| SaaS | Trial signup | sign_up event with plan and source parameters |
| B2B lead generation | Submitted lead form | generate_lead event and CRM lead status |
| Local service | Phone call | click_to_call event and call tracking source |
Which CRO tracking questions precede analysis?
CRO analysis requires tracking questions that define the conversion goal, target page, user action, funnel step, traffic segment and success metric before any test or recommendation begins, because measurement gaps create weak evidence and unreliable optimization decisions.
CRO tracking questions are the pre-analysis questions used to decide what events, funnels, segments and outcomes require measurement. They connect conversion goals, high-traffic pages, conversion paths and qualitative evidence before analysis starts.
- What primary conversion goal defines success?
- Which page or funnel step receives the analysis?
- Which user action marks progress or completion?
- Which traffic segment or audience group matters?
- Which metric separates success from noise?
- Which qualitative signal explains the behavior pattern?
| Tracking question | Required tracking setup |
|---|---|
| Which goal matters? | GA4 key event, CRM status and revenue field |
| Which page receives traffic? | GA4 Landing page report with sessions and source/medium |
| Which action indicates intent? | Event tracking for clicks, forms, carts and checkout steps |
| Which segment differs? | Audience dimensions for device, channel, visitor type and location |
| Which path leaks users? | GA4 Funnel exploration with step completion and abandonment rate |
| Which evidence explains friction? | Heatmaps, session recordings, form analytics and survey tags |
How does digital analytics identify, measure and validate conversion rate optimization opportunities?
Digital analytics identifies CRO opportunities by finding conversion leaks, measuring user behavior and validating changes with conversion metrics, funnel data and experiment results across traffic source, landing page, device category, audience segment and conversion path.
The process starts with data quality, then connects KPIs, user behavior, conversion leaks and test evidence into an experimentation roadmap.
Digital analytics supports CRO through the steps below.
- Validate GA4 events, conversion tracking, traffic data and source/medium consistency.
- Map conversion paths from landing page to final macro-conversion.
- Find funnel drop-off by step completion rate and abandonment rate.
- Segment users by device, channel, audience, location and visitor type.
- Compare conversion value, revenue per visitor and guardrail metrics.
- Validate the change with A/B testing, sample size and experiment results.
| Analytics task | Data source | CRO use |
|---|---|---|
| Funnel leak detection | GA4 Funnel exploration | Find the step with the largest user loss |
| Traffic quality analysis | GA4 source/medium and Google Ads | Separate high-intent visits from low-quality sessions |
| Landing page diagnosis | GA4 Landing page report and heatmaps | Prioritize pages with high sessions and weak key event rate |
| Behavior friction review | Session recordings and form analytics | Explain hesitation, rage clicks and abandonment |
| Experiment validation | A/B platform and GA4 key events | Compare control and variation with guardrail metrics |
How is conversion and traffic data validated?
Conversion and traffic data is trusted only after tracking accuracy, source quality, event configuration and unexplained performance shifts are validated across GA4, tag management, conversion platforms and raw behavior records.
Use the checks below to validate conversion and traffic data before CRO analysis.
- Compare GA4 key events against CRM, ecommerce platform or lead records.
- Check duplicate events, missing parameters and incorrect trigger firing.
- Review source/medium for self-referrals, payment gateways and campaign tagging errors.
- Inspect traffic spikes for bot traffic, fraudulent activity and low-engagement sessions.
- Test conversion tracking in DebugView, Realtime and Tag Assistant.
- Review conversion rates by device, browser and landing page for unexplained shifts.
A CRO recommendation based on broken conversion tracking turns measurement error into design work. Data validation protects the baseline, the hypothesis and the final test readout.
What is the current conversion rate baseline?
The current conversion rate baseline is the existing percentage of users or sessions that complete a target conversion before CRO changes, tests or campaigns are applied, using the same audience, time range, device mix and attribution rules planned for analysis.
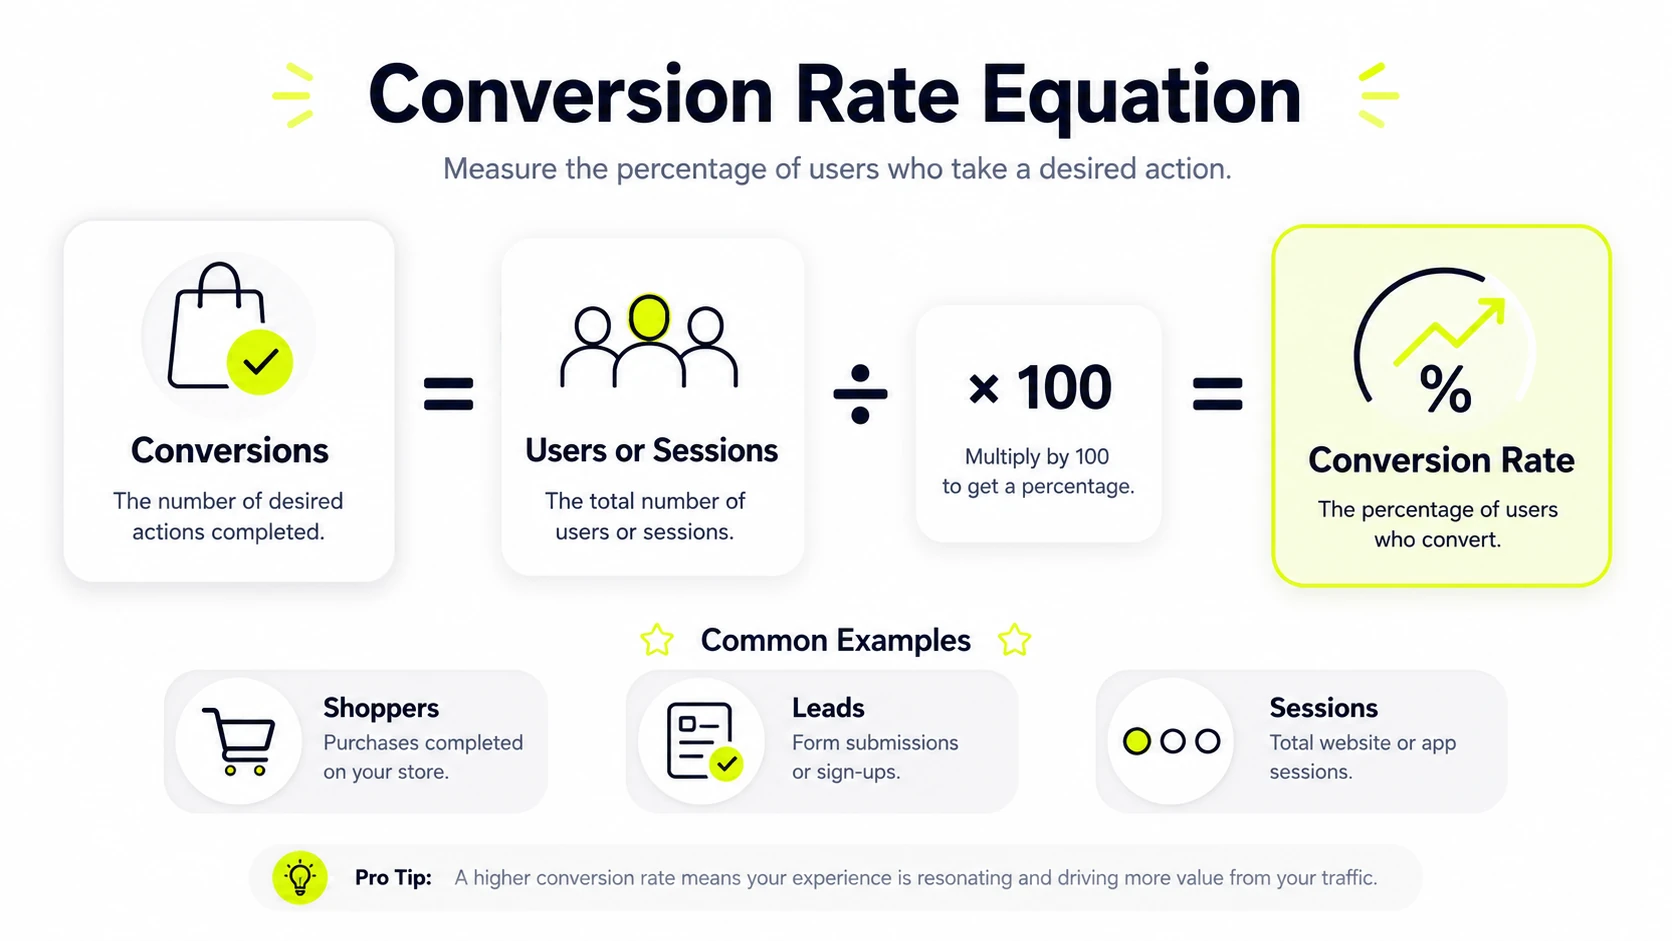
Baseline conversion rate sets the control experience for target lift calculations. The formula is:
Conversion rate = conversions / users or sessions x 100
Benchmark context helps classify the baseline, but the site's prior performance remains the cleanest comparison. According to Dynamic Yield ecommerce benchmark data, last updated in April 2026, the global ecommerce conversion rate was 2.76%, with Americas at 2.97%, based on completed purchases by visitors over the past twelve months.
What is a good conversion rate for each segment?
A good conversion rate depends on the segment being measured, because ecommerce, B2B lead generation, paid search, organic traffic, mobile users, desktop users and returning visitors convert at different rates with different intent, value and friction patterns.
| Segment | Typical good range | How to interpret it |
|---|---|---|
| Overall ecommerce | 2% to 4% | Compare against product category, price point and checkout friction. |
| B2B lead generation | 2% to 5% | Separate raw form volume from qualified lead rate. |
| Email traffic | 4% to 6% | High brand familiarity often raises conversion intent. |
| Organic search | 2.5% to 4.5% | Query intent and landing page match control the range. |
| Paid social | 0.5% to 1.5% | Cold traffic often requires assisted conversion review. |
No single conversion rate is good for every website. Compare each segment against its own baseline, industry benchmark, traffic intent, device mix and revenue quality.
How do you find which traffic sources drive the highest-quality conversions?
The traffic sources most likely to convert are usually email, organic search, direct traffic, referral traffic and high-intent paid search because these users show stronger trust, intent or prior brand engagement than broad paid social or low-intent display visits.
Traffic source tools include GA4 Traffic acquisition, GA4 User acquisition, Google Ads, Search Console, CRM source fields and ecommerce platform attribution reports.
According to Red Stag Fulfillment ecommerce benchmark data, published on 2025-05-19 and updated on 2026-05-05, referral traffic converted at 5.4%, email traffic at 5.3%, direct traffic at 2.2%, organic search at 2.1% and paid search at 1.4%.
| Rank | Traffic source | Quality signal |
|---|---|---|
| 1 | Email traffic | High return visits, repeat purchase rate and conversion value |
| 2 | Referral traffic | Partner trust, qualified sessions and strong lead quality |
| 3 | Organic search | Intent-matched sessions and lower customer acquisition cost |
| 4 | Direct traffic | Brand familiarity and returning visitor conversion |
| 5 | Paid search | High-intent query terms and measurable CPA |
Use source/medium with conversion value, revenue per visitor and lead quality so the ranking measures business quality, not only conversion count.
How do you find which audience segments drive different conversion quality?
You find audience segment conversion quality by comparing conversion rate, conversion value, revenue, CPA, AOV, LTV, retention and qualified lead outcomes across GA4, Google Ads, CRM records and ecommerce order data.
- Create audience segments by device, channel, location, visitor type and behavior.
- Join GA4 key events with Google Ads cost and CRM quality fields.
- Compare macro-conversions, micro-conversions, revenue and customer value.
- Check whether higher conversion rate creates lower quality or smaller orders.
- Prioritize segments with strong value, repeat behavior and available traffic.
Use the following metrics to compare audience segment conversion quality.
| Metric | What it shows | CRO interpretation |
|---|---|---|
| Conversion value | Revenue or assigned value per action | Separates high-value conversions from low-value actions |
| Customer lifetime value | Longer-term customer revenue | Protects against low-quality lead growth |
| Average order value | Average purchase size | Detects discount-driven conversion lift |
| Cost per acquisition | Paid cost per customer or lead | Connects CRO results to media efficiency |
| Retention | Repeat behavior after conversion | Finds segments with durable business value |
How do you find landing pages with high traffic and low conversion rates?
Find landing pages with high traffic and low conversion rates by sorting GA4 landing page data by sessions, key event rate, revenue, engagement rate and source/medium, then prioritizing pages with the largest traffic-to-conversion gap.
A weak landing page has strong session volume but below-baseline conversion rate, revenue, lead rate or key event completion. Use the following checks to identify high-traffic landing pages with weak conversion performance.
- Open the GA4 Landing page report and sort by sessions.
- Add key event rate, revenue, engagement rate and source/medium.
- Filter pages with enough traffic for stable comparison.
- Compare each page against the site baseline and segment baseline.
- Review heatmaps, scroll depth and CTA clicks for behavior evidence.
| Priority signal | Data source | Action |
|---|---|---|
| High sessions, low key event rate | GA4 Landing page report | Inspect offer match and CTA visibility |
| High paid traffic, weak revenue | GA4 and Google Ads | Review query intent and landing page promise |
| High engagement, low form completion | GA4 and form analytics | Audit field friction and validation errors |
| Low scroll depth, low CTA clicks | Heatmaps | Move critical action and proof higher on page |
How do you find where users drop off in the conversion funnel?
Find where users drop off in the conversion funnel by mapping each funnel step, measuring step completion rate and abandonment rate, then identifying the step with the largest user loss across device, source/medium, landing page and user type.
Funnel drop-off analysis compares how many users enter each step against how many continue to the next step. Build a GA4 Funnel exploration, define key events for each stage, segment the data and inspect behavior evidence before selecting a fix. Use the following checks to identify and diagnose conversion funnel drop-offs.
According to Baymard Institute cart abandonment benchmark data, updated on 2026-05-03, the average shopping cart abandonment rate was 70.22% across 50 studies, which makes checkout-step abandonment a high-priority ecommerce funnel metric.
- List every funnel step from entry page to macro-conversion.
- Assign one GA4 event or page condition to each step.
- Measure users, completion rate and abandonment rate at each step.
- Segment drop-off by device, traffic source, landing page and user type.
- Review session recordings, heatmaps, form analytics and error events.
| Drop-off signal | Diagnostic source | Likely cause |
|---|---|---|
| Large loss after product view | GA4 Funnel exploration and heatmaps | Weak product detail, price mismatch or missing proof |
| Large loss at form start | Form analytics | Too many fields or unclear required inputs |
| Large loss at payment step | Checkout events and error logs | Payment failure, surprise cost or trust issue |
| Mobile-only abandonment | Device segment and recordings | Layout friction, slow load or tap target issue |
How do you prioritize CRO opportunities from your analysis?
Prioritize CRO opportunities from analysis by scoring each opportunity against impact, confidence, effort, traffic volume, business value and evidence strength, then ranking the work into a testing roadmap before design or development starts.
CRO prioritization is the process of ranking optimization opportunities before testing. It turns GA4 findings, heatmaps, funnel analysis, form analytics, session recordings and customer feedback into a scored backlog.
- List every issue found in analytics and behavior evidence.
- Group issues by funnel step, page type, audience segment and metric affected.
- Score each issue using PIE or ICE criteria.
- Add traffic volume and business value to avoid low-impact tests.
- Rank the roadmap by evidence strength and implementation effort.
Use the following scoring criteria to prioritize CRO opportunities from analysis.
| Criterion | Score meaning | Use in roadmap |
|---|---|---|
| Impact | Expected conversion or revenue effect | Ranks changes tied to commercial outcomes |
| Confidence | Strength of analytics and behavior evidence | Reduces guesswork-based redesign |
| Effort | Design, development and QA load | Separates quick fixes from larger tests |
| Traffic volume | Users exposed to the issue | Protects sample size and test speed |
| Business value | Revenue, lead quality or customer value | Prevents optimizing shallow conversions |
What is the measurable hypothesis for each CRO opportunity?
A measurable CRO hypothesis is a testable statement connecting an observed conversion problem, proposed page or funnel change, affected audience and expected metric improvement with evidence from analytics, funnel drop-offs, heatmaps, form analytics, recordings or feedback.
Every CRO opportunity requires one measurable hypothesis before testing. Use the following structure to write a measurable CRO hypothesis for each opportunity.
Formula: If we change X for Y audience, then Z metric improves because A evidence shows the current friction.
- Name the observed conversion problem.
- Specify the affected page, funnel step or audience.
- Describe the proposed change in one measurable action.
- Select the primary metric and guardrail metrics.
- Attach the evidence source used to justify the test.
| Observed problem | Hypothesis example | Primary metric |
|---|---|---|
| High checkout abandonment | If shipping cost appears before payment, then checkout completion increases because recordings show exits after cost reveal. | Checkout completion rate |
| Low form completion | If optional fields move after submission, then lead form completion increases because form analytics shows abandonment at field six. | Form_submit rate |
| Weak paid landing page rate | If the hero message matches the paid search query, then demo requests increase because source/medium data shows high bounce on paid sessions. | Demo request rate |
What sample size and test duration are needed before starting the CRO test?
A CRO test requires enough sample size and duration to detect the expected conversion lift with 95% statistical confidence, 80% statistical power and at least one full business cycle of user behavior before control and variation results are interpreted.
Sample size is the number of users or sessions required per group. Test duration is the calendar period required to collect that sample across normal weekday, weekend and campaign patterns. Use the following criteria to estimate CRO test sample size and duration before launch.
According to AB Tasty sample size calculation guidance, published in April 2026, A/B test sample planning uses baseline conversion rate, minimum detectable effect, statistical power and confidence level to estimate required observations per variation.
- Record the baseline conversion rate for the exact audience.
- Set the minimum detectable effect before launch.
- Use a calculator with 95% confidence and 80% power.
- Estimate duration from eligible traffic per variation.
- Run through a complete business cycle before interpretation.
| Criterion | Planning value | Reason |
|---|---|---|
| Baseline conversion rate | Current segment rate | Controls required sample size |
| Minimum detectable effect | Business-relevant lift | Smaller effects require larger samples |
| Confidence | 95% | Common reliability threshold |
| Power | 80% | Common probability of detecting a true effect |
| Duration | Full business cycle | Captures weekday, weekend and campaign behavior |
How do you know if a test variation outperformed the control?
A test variation outperformed the control only when the variation produced positive uplift in the primary conversion metric and passed statistical reliability checks without harming revenue, lead quality, average order value or other guardrail metrics.
- Confirm the primary metric was selected before launch.
- Check sample size, duration, confidence and power requirements.
- Compare control group and variation group conversion rate.
- Calculate uplift against the baseline and confidence interval.
- Review guardrail metrics before declaring a winning variation.
Use the following checks to decide whether the variation outperformed the control.
| Result pattern | Interpretation | Decision |
|---|---|---|
| Higher conversion rate, stable guardrails | Variation improved target metric without business-quality loss | Ship the change |
| Higher conversion rate, lower revenue per visitor | Variation increased shallow actions | Reject or redesign |
| Positive uplift, weak sample size | Result lacks reliability | Continue until planned sample completes |
| No meaningful difference | Observed lift fits normal variation | Keep control and test a stronger hypothesis |
Which segments changed after the CRO test?
After a CRO test, segment change means a measurable performance shift inside a subgroup, not only a change in total conversions, so analysis compares conversion rate, revenue, engagement and guardrail metrics by device, source, visitor type, location and customer value group.
Use the following segment checks to understand where the CRO test changed performance.
| Segment check | Metric comparison | What it reveals |
|---|---|---|
| Device type | Mobile conversion rate vs desktop conversion rate | Finds layout, speed and checkout friction differences |
| Traffic source | Conversion rate and revenue by source/medium | Separates channel intent from page effect |
| Visitor type | New vs returning users | Shows whether trust or familiarity changed behavior |
| Location | Conversion and lead quality by region | Finds shipping, service area or market mismatch |
| Customer value | AOV, LTV and qualified lead rate | Tests whether lift improved business quality |
Did the CRO change improve conversions without harming quality or revenue?
CRO change improved performance only if it increased the target conversion metric without reducing revenue, average order value, lead quality, customer value or other guardrail metrics that detect harmful side effects from the change.
Guardrail metrics are business-quality metrics used to detect harmful side effects from a CRO change. Use the following guardrail checks to confirm whether the CRO change improved performance without harming business quality.
| Guardrail metric | Risk detected | Pass condition |
|---|---|---|
| Revenue per visitor | More conversions with lower revenue | Revenue per visitor stays flat or increases |
| Average order value | Discount-led conversion lift | AOV stays within baseline range or improves |
| Lead quality | More unqualified submissions | Qualified lead rate stays flat or increases |
| Customer value | Short-term actions from low-value users | LTV and retention do not decline |
| Refund or cancellation rate | Poor-fit customers | Refunds and cancellations stay within baseline range |
How are CRO insights communicated to stakeholders?
CRO insights are communicated to stakeholders as a concise business narrative that links the test finding, user behavior, conversion impact, revenue impact and recommended next action to the decision each audience owns.
Stakeholders require decisions, not raw analytics exports. The report connects test results to business outcomes and separates executive, marketing, product and development needs. Use the following reporting structure to communicate CRO insights to stakeholders.
| Stakeholder | Report focus | Required evidence |
|---|---|---|
| Executive | Business impact and risk | Revenue impact, confidence level and recommendation |
| Marketing | Traffic source and audience performance | Source/medium, CPA, conversion value and segment lift |
| Product | User behavior and friction | Funnel drop-off, recordings, heatmaps and guardrail metrics |
| Development | Implementation and QA | Variant details, tracking events, error logs and owner |
| Analytics | Measurement validity | Sample size, primary metric, attribution rules and data quality |
The summary includes the finding, evidence, impact, confidence level, risk, recommendation and owner so each decision has a documented measurement basis.
Are mobile users converting differently from desktop users?
Yes. Mobile users convert differently from desktop users because device category, screen size, form friction, page speed and purchase intent affect behavior; compare mobile conversion rate, desktop conversion rate, average order value and checkout friction before joining both devices into one result.
Device comparison separates layout friction from audience intent. Mobile and desktop segments belong in separate CRO baselines when screen size, page speed, checkout friction and average order value differ.
Does page speed or Core Web Vitals affect conversion rate?
Yes. Page speed and Core Web Vitals affect conversion rate because slow loading, poor responsiveness and layout shifts add friction before users complete forms, checkout steps, demo requests or purchases, especially on mobile traffic with smaller screens and weaker network conditions.
According to Deloitte and Google research, published in March 2020, a 0.1-second mobile site speed improvement increased retail conversions by 8.4% and travel conversions by 10.1%.
Do trust signals and social proof affect conversion behavior?
Yes. Trust signals and social proof affect conversion behavior because reviews, testimonials, badges, guarantees and recognizable proof reduce uncertainty before users submit a form, start checkout, book a call or create an account.
Measure these elements through CTA clicks, scroll depth, review-section visibility, assisted conversions and segment-level lead quality. Treat a trust signal as a page element, not a standalone outcome.
Why do CRO decisions require accurate web analytics data?
CRO decisions require accurate web analytics data because broken tracking, missing events, wrong conversion goals or unreliable attribution turns measurement error into page changes, weak hypotheses and invalid experiment results.
The primary metric, event tracking, traffic source and data quality checks define the evidence base for every recommendation. Bad data inflates or hides conversion loss.
How do web analytics reveal where users drop off before converting?
Web analytics reveal where users drop off before converting by showing which funnel steps, pages, events or checkout stages lose users through funnel exploration, purchase journey reports, path exploration and event tracking.
GA4 funnel exploration identifies drop-off points before testing fixes. Path exploration shows common detours, repeated actions and exits that explain user movement outside the expected checkout funnel.
What on-page behavior explains conversion friction?
On-page behavior explains conversion friction when users hesitate, abandon forms, rage click, scroll without acting, miss CTAs or exit before completing a key action recorded through heatmaps, session recordings, form analytics and event tracking.
Common on-page behavior signals of conversion friction are listed below.
- Rage clicks near disabled buttons, broken elements or confusing UI states.
- Low scroll depth before the offer, proof or primary CTA appears.
- Form abandonment at required fields, validation errors or phone inputs.
- Repeated backtracking between pricing, product detail and checkout pages.
- Exit events after shipping cost, account creation or payment error messages.
Conversion rate optimization uses digital analytics, funnel measurement and controlled testing to improve business outcomes from existing website traffic when conversion goals, traffic sources, audience segments, funnel drop-off and A/B testing evidence stay connected from baseline to final report.

Written by
Zunnun
GA4 consultant and GTM expert helping businesses fix broken tracking. Specializes in conversion tracking, marketing attribution and semantic SEO.
Free Analytics Audit
Is your tracking setup costing you revenue?