Types of Digital Analytics: Complete Guide to Web, Marketing & Business Analytics
TL;DR: Digital analytics encompasses four main types—descriptive, diagnostic, predictive, and prescriptive—each serving unique purposes in transforming raw data into actionable business insights. From basic web tracking to advanced AI-powered predictions, understanding these analytics categories helps businesses make smarter decisions, improve ROI by up to 130%, and stay competitive in today's data-driven marketplace.
Listen up:
Every click, scroll, and purchase tells a story about your business. But here's the kicker—90% of the world's data was created in just the last two years, yet only 12% of companies actually use their analytics effectively.
That's where understanding different digital analytics types becomes your secret weapon.
Whether you're tracking website visitors, measuring campaign performance, or predicting customer behavior, choosing the right analytics approach can mean the difference between shooting in the dark and hitting your targets with laser precision.
What Are Digital Analytics? Understanding the Fundamentals
Think of digital analytics as your business's GPS system.
Just as GPS tracks your location and guides you to your destination, digital analytics monitors your online performance and shows you the path to success. It's the systematic collection, measurement, and interpretation of data from digital channels—websites, apps, social platforms, and beyond.
But here's what makes it powerful:
Digital analytics transforms overwhelming data streams into clear, actionable insights. Instead of drowning in numbers, you get answers to critical questions: Who are your customers? What do they want? Where do they struggle? When should you engage them?
The foundation rests on three pillars:
Data Collection: Gathering information through tracking codes, pixels, and APIs that monitor user interactions across touchpoints. Think Google Analytics tracking your website visitors or Facebook Pixel monitoring ad conversions.
Data Processing: Cleaning, organizing, and structuring raw data into meaningful segments. This is where chaos becomes clarity—turning millions of data points into organized reports.
Data Analysis: Extracting patterns, trends, and insights that drive decisions. It's not just about what happened, but understanding why it matters for your business growth.
According to McKinsey research, companies using customer analytics comprehensively see 126% higher profits than competitors. That's not a typo—we're talking about doubling your profit potential through smart data use.
4 Primary Types of Digital Analytics Explained
Ready to dive deeper?
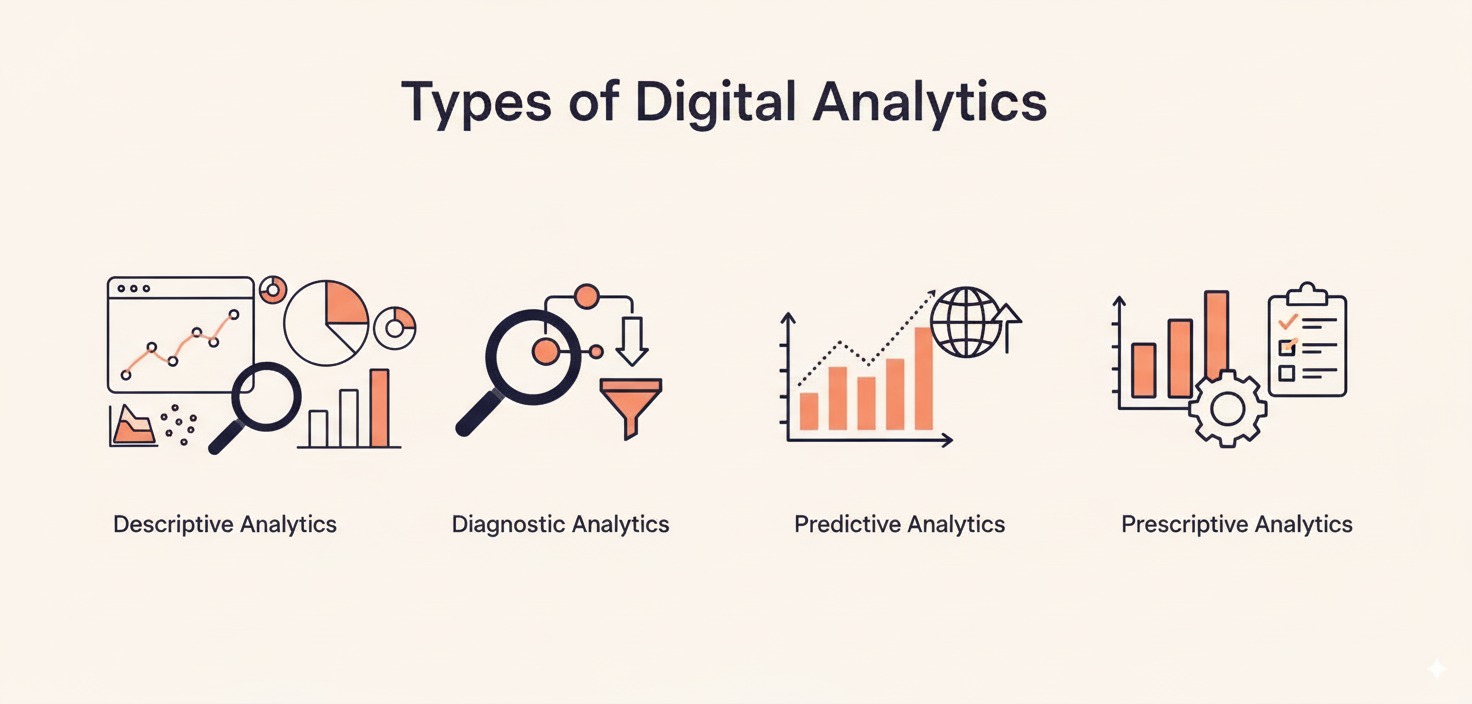
Every successful analytics strategy combines four distinct approaches, each answering different questions about your business performance. Let's break them down:
1. Descriptive Analytics: Understanding What Happened
Descriptive analytics is your rearview mirror—showing exactly what occurred in your business.
This foundational analytics type represents 80% of all business analytics today. It transforms raw data into digestible reports, dashboards, and visualizations that reveal past performance patterns. You're looking at metrics like page views, conversion rates, bounce rates, and revenue trends.
Here's what makes it essential:
Real-time monitoring gives you instant visibility into current performance. Imagine watching your Black Friday sales spike in real-time or catching a website crash within seconds. Tools like Google Analytics 4 and Adobe Analytics excel at providing these immediate insights.
Historical analysis uncovers long-term patterns. By examining six months of data, you might discover that Tuesday afternoons generate 40% more conversions than Monday mornings—knowledge that transforms your marketing timing.
Key applications include:
- Monthly revenue reports showing sales trends
- Website traffic analytics revealing visitor behavior
- Email campaign performance measuring open and click rates
- Social media engagement tracking likes, shares, and comments
The beauty? Descriptive analytics requires minimal technical expertise. Even small businesses can leverage free tools like Google Analytics to understand their performance metrics immediately.
2. Diagnostic Analytics: Discovering Why It Happened
Now we're getting to the good stuff.
While descriptive analytics shows you dropped 30% in conversions last month, diagnostic analytics reveals why. It's the detective work of data analysis—digging deeper to uncover root causes behind performance changes.
This analytical approach uses techniques like:
Drill-down analysis: Breaking aggregate data into granular segments. Maybe your overall conversion drop stems from mobile users experiencing slow load times on product pages.
Data discovery: Identifying correlations and anomalies. Perhaps that traffic spike correlates with a viral TikTok mention you weren't even aware of.
Correlation analysis: Understanding relationships between variables. You might find that customers who read three blog posts convert 5x more often than single-page visitors.
According to Gartner, organizations using diagnostic analytics reduce problem resolution time by 69%. That's because you're not guessing—you're following the data trail to exact causes.
Real-world example? Target discovered that customers buying unscented lotion, supplements, and cotton balls were likely pregnant. This diagnostic insight revolutionized their marketing personalization strategy.
3. Predictive Analytics: Forecasting What Will Happen
Here's where things get exciting.
Predictive analytics uses historical data, statistical algorithms, and machine learning to forecast future outcomes. It's like having a crystal ball—except this one's powered by data science, not magic.
The numbers speak volumes: Companies using predictive analytics see 73% higher sales growth than non-users.
Key predictive capabilities include:
Customer lifetime value prediction: Identifying which customers will generate the most revenue over time. Netflix uses this to decide how much to invest in retaining specific user segments.
Churn forecasting: Spotting customers likely to cancel before they actually do. Spotify's algorithms identify at-risk subscribers and trigger retention campaigns automatically.
Demand forecasting: Predicting product demand to optimize inventory. Amazon's anticipatory shipping even starts moving products before you click "buy."
Lead scoring: Ranking prospects by conversion probability. Salesforce Einstein analyzes thousands of signals to prioritize your hottest leads.
The technology leverages:
- Regression analysis for trend forecasting
- Classification algorithms for customer segmentation
- Time series analysis for seasonal predictions
- Neural networks for complex pattern recognition
But remember: Predictive analytics requires quality historical data. Garbage in, garbage out—so ensure your data collection is solid before attempting predictions.
4. Prescriptive Analytics: Determining What Should Happen
This is the holy grail of analytics.
Prescriptive analytics doesn't just predict the future—it recommends specific actions to achieve desired outcomes. It's your AI-powered business advisor, suggesting optimal decisions based on complex scenario analysis.
Think about it:
While predictive analytics might forecast a 20% sales drop next quarter, prescriptive analytics tells you exactly which marketing campaigns, pricing adjustments, and inventory changes will prevent that decline.
Advanced applications include:
Dynamic pricing optimization: Airlines adjust ticket prices thousands of times daily based on demand, competition, and capacity. Delta Airlines credits prescriptive analytics for generating $500 million in additional annual revenue.
Marketing mix modeling: Determining optimal budget allocation across channels. Should you shift 20% from Facebook to Google Ads? Prescriptive models calculate the exact ROI impact.
Supply chain optimization: UPS's ORION system uses prescriptive analytics to optimize delivery routes, saving 10 million gallons of fuel annually.
The technology combines:
- Optimization algorithms
- Simulation modeling
- Decision tree analysis
- Artificial intelligence and machine learning
Fair warning: Prescriptive analytics requires significant investment in technology and expertise. But for enterprises, the ROI justifies the cost—often returning $13 for every dollar invested.
Digital Analytics Categories by Business Function
Let's get practical.
Different business functions require specialized analytics approaches. Your e-commerce site needs different insights than your email campaigns or social media presence. Here's how to match analytics types to specific business needs:
Web Analytics Tools and Platforms
Which analytics tool is best for websites?
The answer depends on your business size, budget, and technical capabilities. But here's the breakdown:
Google Analytics 4 (GA4) dominates with 85% market share for good reason. It's free, comprehensive, and integrates seamlessly with Google's ecosystem. Perfect for small to medium businesses tracking website performance, user behavior, and conversion funnels.
Key features that matter:
- Cross-device tracking following users across phones, tablets, and desktops
- Enhanced e-commerce analytics measuring product performance
- Automated insights using machine learning to surface important trends
- Privacy-focused design adapting to cookieless tracking
Adobe Analytics serves enterprise needs with advanced segmentation, real-time data processing, and custom attribution modeling. Yes, it's expensive—starting around $100,000 annually—but Fortune 500 companies swear by its depth.
Matomo offers privacy-compliant analytics for businesses prioritizing data ownership. Unlike Google Analytics, you host data on your servers, maintaining complete control and GDPR compliance.
Pro tip: Start with GA4's free version. As you grow, layer in specialized tools like Hotjar for heatmaps or Optimizely for A/B testing. The best analytics stack combines multiple tools addressing specific needs.
Marketing Analytics Solutions
Marketing analytics transforms campaign guesswork into scientific precision.
Modern marketing analytics platforms track customer journeys across touchpoints, measure campaign ROI, and optimize budget allocation. The result? Companies using marketing analytics see 15-20% increases in ROI.
Essential capabilities include:
Multi-touch attribution: Understanding which touchpoints drive conversions. Maybe that Facebook ad initiated interest, but the email campaign sealed the deal. Tools like Bizible and Attribution reveal the complete picture.
Campaign performance tracking: Monitoring metrics across channels in unified dashboards. HubSpot and Marketo consolidate data from email, social, paid ads, and content marketing.
Marketing mix modeling: Determining optimal channel investment. Should you double down on LinkedIn or shift budget to Google Ads? Platforms like Marketing Evolution calculate precise recommendations.
Customer journey analytics: Mapping paths from awareness to purchase. Google Analytics 4's path exploration shows exactly how customers navigate toward conversion.
The game-changer? Unified reporting that connects marketing efforts to revenue. No more arguing about marketing's value—the numbers prove impact definitively.
Social Media Analytics
Social media generates 500 million tweets, 4.3 billion Facebook messages, and 95 million Instagram posts daily.
That's a goldmine of customer insights—if you know how to mine it.
Social analytics goes beyond vanity metrics (likes and followers) to measure genuine business impact. Smart brands track:
Engagement quality: Not just counting comments, but analyzing sentiment. Are people praising or complaining? Tools like Brandwatch and Sprinklr use AI to gauge emotional response.
Share of voice: Your brand mentions versus competitors. If Nike owns 40% of sneaker conversations while you have 2%, you know where to focus.
Conversion attribution: Connecting social interactions to sales. Facebook Attribution and Google Analytics track how social engagement influences purchases.
Influencer impact: Measuring actual ROI from influencer partnerships. Platforms like CreatorIQ track everything from reach to revenue generation.
Sprout Social reports that 90% of marketers say social media analytics directly impacts strategy. Yet only 30% feel confident in their measurement approach.
The fix? Focus on metrics tied to business objectives. Forget follower counts—track click-through rates, conversion rates, and customer acquisition costs from social channels.
E-commerce Analytics
E-commerce analytics is where data meets dollars.
Every product view, cart addition, and checkout abandonment tells you something crucial about customer behavior. The best e-commerce brands obsess over these insights, optimizing constantly for higher conversions.
Critical metrics that drive revenue:
Conversion funnel analysis: Identifying where customers drop off. If 70% abandon at shipping costs, you might need free shipping thresholds. Tools like Google Analytics Enhanced E-commerce track every funnel stage.
Product performance metrics: Understanding which products drive profits. Maybe that bestseller actually has slim margins while a slower seller generates 3x profit per unit.
Cart abandonment analytics: 69.99% of carts are abandoned, costing e-commerce $18 billion annually. Analytics reveals why—unexpected costs, complicated checkout, or security concerns.
Customer lifetime value: Knowing acquisition cost versus long-term value. Amazon famously loses money on first purchases, betting on lifetime relationships.
Shopify Analytics, WooCommerce Analytics, and BigCommerce Analytics provide built-in tracking. But serious sellers add specialized tools like Glew.io or Kissmetrics for deeper insights.
Advanced Analytics Types for Enterprise
Enterprise analytics operates at massive scale, processing billions of data points across global operations. Here's what separates enterprise-grade analytics from basic tracking:
Customer Analytics and Segmentation
Customer analytics transforms anonymous visitors into understood individuals through behavioral analysis and purchase patterns.
The payoff? Personalization delivers 5-8x ROI on marketing spend.
Key segmentation strategies:
- RFM analysis: Identifying VIP customers based on recency, frequency, and monetary value
- Behavioral cohorts: Grouping by actions, not demographics (Netflix segments by viewing habits, not age)
- Predictive segmentation: AI identifies future high-value customers before they convert
- Micro-segmentation: Creating thousands of segments for ultra-personalization
Enterprise platforms like Segment and Amplitude process millions of events daily, updating profiles in real-time. Amazon generates unique homepages using 100+ behavioral signals per visitor.
Mobile App Analytics
Mobile drives 54% of global traffic, yet 25% of apps are abandoned after one use.
Critical mobile metrics:
- Retention rates: DAU/MAU ratios revealing true engagement
- Session metrics: Instagram optimizes for their 53-minute daily average
- Performance tracking: One-second delays drop conversions 20%
- In-app purchases: King discovered 1.9% of players generate 50% of revenue
Firebase, Flurry, and AppsFlyer track everything from install sources to uninstall reasons, providing complete lifecycle visibility.
Video and Content Analytics
What metrics are used in content analytics?
Modern content analytics goes beyond page views to measure actual engagement and business impact.
Essential content metrics:
- Attention time: Medium's "read ratio" shows only 40% finish articles
- Scroll depth: Reveals if users reach your CTA
- Video engagement: Videos under 2 minutes get 50% more engagement
- Content attribution: That blog post influences 30% of eventual purchases
Tools like Parse.ly and Chartbeat provide real-time intelligence. The New York Times uses these insights to optimize headlines and perfect publication timing.
Pro tip: Track recirculation rate—how often users consume multiple pieces—as it predicts customer loyalty better than any single metric.
Choosing the Right Analytics Type for Your Business
Here's the truth:
You don't need every analytics type immediately. Start with what drives immediate value, then expand as you grow. Here's your roadmap:
For Startups (Under $1M revenue):
Focus on descriptive analytics using free tools. Google Analytics, Facebook Insights, and basic email metrics provide sufficient insights. Master the fundamentals before advancing.
For Growing Businesses ($1M-$10M revenue):
Add diagnostic analytics to understand performance drivers. Invest in tools like Hotjar for user behavior, Klaviyo for email analytics, and Supermetrics for unified reporting. Budget 2-3% of revenue for analytics tools.
For Established Companies ($10M-$100M revenue):
Incorporate predictive analytics for competitive advantage. Platforms like Segment for customer data, Optimizely for testing, and Tableau for visualization become essential. Hire dedicated analysts or partner with consultancies.
For Enterprises ($100M+ revenue):
Deploy full-spectrum analytics including prescriptive capabilities. Build data lakes, implement AI/ML platforms, and create dedicated analytics teams. Investment can reach millions but returns 10-20x ROI.
Consider these factors:
Industry requirements: E-commerce needs robust transaction analytics. SaaS requires cohort analysis. Media companies prioritize content analytics. Match tools to industry standards.
Technical capabilities: Be realistic about your team's skills. Powerful tools become expensive paperweights without proper expertise.
Data maturity: You can't run before walking. Build strong data collection first, then add sophisticated analysis layers.
Budget allocation: Follow the 70-20-10 rule: 70% on proven analytics approaches, 20% on emerging capabilities, 10% on experimental technologies.
Remember: The best analytics strategy isn't the most sophisticated—it's the one you'll actually use consistently.