What Is Digital Analytics? Tools, Benefits & Challenges
Introduction
Digital analytics is the systematic collection, measurement, and analysis of digital data from websites, mobile apps, and marketing campaigns. It helps businesses understand customer behavior, optimize user experiences, and make data-driven decisions.
Key components include data tracking, analysis, reporting, and optimization.
Digital Data vs Data vs Web Analytics: What's the Real Difference?
Think digital analytics is just another buzzword? Think again.
Digital analytics is the umbrella term that encompasses all forms of digital data analysis. It includes everything from website metrics to mobile app engagement and social media performance.
Web analytics, on the other hand, is a specific subset of digital analytics. It focuses exclusively on website data—page views, bounce rates, and conversion funnels.
Data analytics? That's the grandparent of them all. It covers any type of data analysis, whether it's digital footprints or traditional offline metrics like in-store sales patterns.
Digital Analysis vs Digital Marketing Analysis: Are They the Same Thing?
Here's where it gets interesting:
Digital analysis examines all digital touchpoints across your entire business ecosystem. It's the complete picture—from customer service chatbots to internal productivity tools.
Digital marketing analysis zeros in on marketing-specific metrics. Think campaign performance, ad spend efficiency, and marketing attribution models.
The relationship? Digital marketing analysis is a critical component of the broader digital analysis framework. You can't have comprehensive business intelligence without understanding your marketing performance metrics.
What Are the 4 Types of Digital Analytics?
Want to know the secret sauce of data-driven success? It starts with understanding these four fundamental types:
1. Descriptive Analytics This answers "What happened?" It's your basic reporting dashboard showing visitor counts, conversion rates, and revenue numbers.
2. Diagnostic Analytics Now we're asking "Why did it happen?" This digs deeper into root causes—why did conversions drop last Tuesday?
3. Predictive Analytics Here's where it gets exciting: "What will happen?" Using historical patterns to forecast future customer behavior and trends.
4. Prescriptive Analytics The holy grail: "What should we do?" This recommends specific actions to optimize outcomes based on complex algorithms.
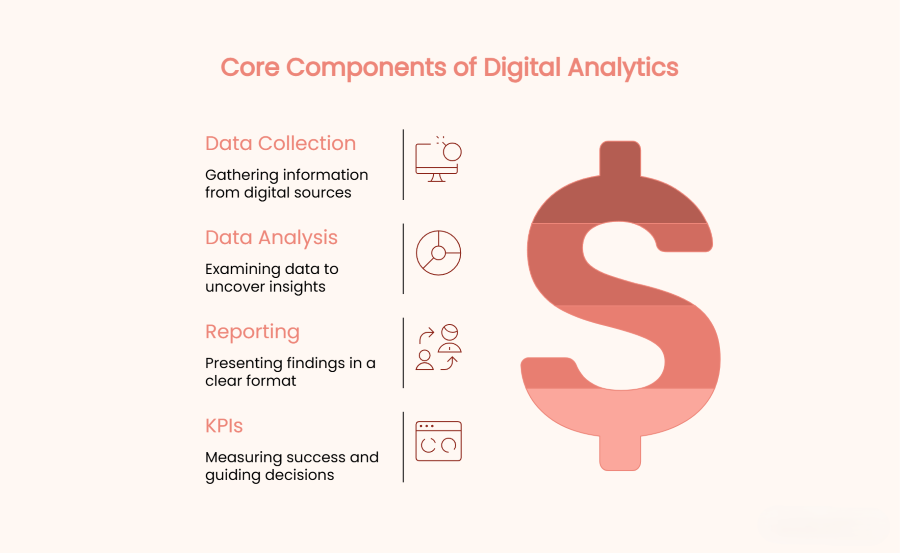
What Are the Core Components of Digital Analytics?
Picture this: You're sitting on a goldmine of customer data, but without the right framework, it's just expensive dirt.
Every successful analytics ecosystem operates through four interconnected components that transform raw data into business growth. Miss one, and the whole system collapses.
Quality Data Tracking: The Foundation of Everything
Here's the uncomfortable truth: According to IBM, poor data quality costs U.S. businesses $3.1 trillion annually. That's why quality tracking isn't optional—it's survival.
Quality data tracking encompasses three critical elements:
Collection Infrastructure Your tags, pixels, and SDKs are the sensory organs of your digital nervous system. Google Tag Manager, segment tracking, server-side tagging—these tools capture every micro-interaction across websites, apps, and marketing channels.
Data Governance But here's what most people miss: Collection without standards creates chaos. You need naming conventions, data dictionaries, and validation rules that ensure consistency across all touchpoints.
Real-time Verification Set up automated alerts for tracking failures. When your e-commerce tracking breaks on Black Friday, every minute costs thousands.
Analysis: Where Data Becomes Intelligence
Raw data is like crude oil—valuable but useless until refined. Analysis transforms numbers into narratives through sophisticated techniques:
Segmentation Analysis Slice your audience by behavior, demographics, or lifecycle stage. Discover that mobile users from Instagram convert 3x better than desktop users from email.
Cohort Analysis Track groups over time to understand retention patterns. SaaS companies using cohort analysis reduce churn by 23% on average.
Statistical Modeling Apply regression analysis, correlation matrices, and predictive algorithms. Find hidden relationships between seemingly unrelated metrics.
Here's the kicker: Analysis without context is just mathematics. Always tie findings back to business objectives and customer experience.
Reporting: The Art of Storytelling with Data
Ever presented data that made executives' eyes glaze over?
You're not alone. Forrester Research found that 74% of firms say they want to be "data-driven," but only 29% successfully connect analytics to action. Effective reporting requires three layers:
Automated Dashboards Real-time KPI monitoring for operational decisions. Think Google Data Studio, Tableau, or Power BI updating every 15 minutes with conversion rates, traffic sources, and revenue metrics.
Strategic Reports Weekly and monthly deep-dives examining trends, anomalies, and opportunities. These aren't just charts—they're narratives with clear recommendations.
Executive Summaries One-page insights focusing on business impact, not technical details. Answer three questions: What happened? So what? Now what?
Pro tip: Use the inverted pyramid structure. Lead with conclusions, then support with evidence.
Optimization: Closing the Loop
This is where the magic happens. Optimization transforms insights into measurable improvements through systematic testing and iteration:
A/B Testing Frameworks Test everything—headlines, button colors, checkout flows. Optimizely data shows that companies running 50+ tests annually see 30% higher conversion rates.
Personalization Engines Use behavioral data to customize experiences. Amazon generates 35% of revenue from personalized recommendations.
Continuous Improvement Cycles Implement the PDCA cycle: Plan improvements, Do experiments, Check results, Act on winners. Repeat relentlessly.
Performance Monitoring Set up automated rules and alerts. When cart abandonment spikes above 70%, trigger immediate investigation and response protocols.
Remember: Optimization without measurement is guesswork. Always establish baselines before making changes.
The synergy matters most—these components work like gears in a machine. When properly aligned, they create a self-improving system that continuously enhances customer experience and business performance.
Which Businesses Benefit Most from Digital Analytics Applications?
Every digital business needs analytics, but some see transformative results. Digital analytics benefits extend across industries, but certain sectors experience particularly dramatic improvements when implementing comprehensive measurement strategies:
E-commerce Retailers Track product performance, cart abandonment rates, and customer lifetime value. According to McKinsey research, data-driven e-commerce companies see 23% higher profits.
SaaS Companies Monitor user engagement, feature adoption, and churn rates. Subscription businesses using advanced analytics reduce churn by up to 15%.
B2B Organizations Analyze lead quality, sales pipeline velocity, and account-based marketing effectiveness.
Media and Publishing Measure content engagement, reader behavior, and subscription conversions. Publishers using analytics see 19% higher ad revenue on average.
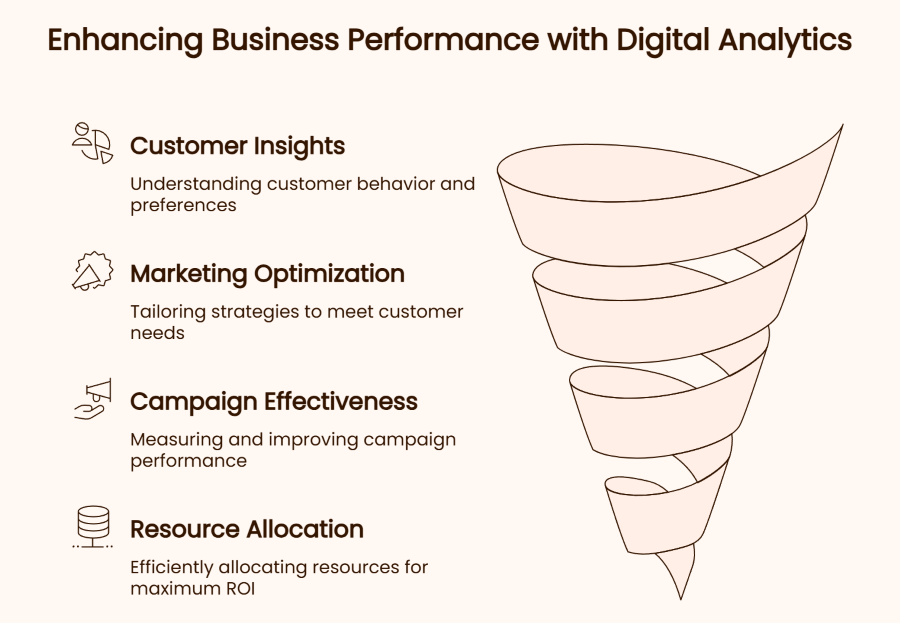
How Does Digital Analytics Benefit Your Business?
Ready for the game-changing advantages?
Data-Driven Decision Making Stop guessing, start knowing. Replace gut feelings with concrete evidence about what works and what doesn't.
Deep Customer Insights Understand your audience's journey—from first touch to loyal advocate. Discover pain points you never knew existed.
ROI Measurement Finally answer: "Is our marketing working?" Track every dollar spent and its return across all channels.
Performance Optimization Identify bottlenecks instantly. A/B test improvements. Scale what works, kill what doesn't.
Studies show companies using analytics are 5 times more likely to make decisions faster than their competition.
Digital Analytics and Business Intelligence: The Power Partnership You Can't Ignore
Digital analytics alone won't cut it anymore. Neither will business intelligence in isolation.
The companies crushing it? They're fusing both into a single decision-making powerhouse.
Digital Analytics vs Business Intelligence: Understanding the Distinction
Here's what separates them—and why you need both:
Digital analytics is your frontline intelligence. It captures every click, scroll, and conversion happening right now on your digital properties. Real-time, granular, and laser-focused on digital behaviour.
Business intelligence? That's your strategic command centre. It combines digital data with sales figures, inventory levels, financial metrics, and market trends to paint the complete business picture.
Think of it this way:
Digital analytics tells you that mobile conversions dropped 30% yesterday.
Business intelligence tells you it's because your top competitor launched a mobile app with one-click checkout while your inventory system had a 4-hour outage affecting 60% of mobile users in the Pacific timezone.
See the difference? One gives you symptoms. The other provides diagnosis and cure.
What Digital Analytics Tools Should You Use?
Here's the million-dollar question every business faces:
With over 8,000 MarTech tools available in 2025, how do you choose the right analytics stack without drowning in options or blowing your budget?
Let's break it down by what actually moves the needle.
Qualitative Analytics Tools: Understanding the "Why" Behind User Behavior
Numbers tell you what happened. Qualitative tools reveal why.
Hotjar (Free-$39/month) Think of it as X-ray vision for your website. Heatmaps show where users click, move, and scroll. Session recordings capture exact user journeys—including those rage-clicks before abandonment. Hotjar's research shows businesses using heatmaps improve conversion rates by 21% on average.
Crazy Egg ($24-$249/month) Beyond basic heatmaps, it offers snapshots, scroll maps, and confetti reports (showing clicks by referral source). The A/B testing feature lets you test changes without touching code.
Microsoft Clarity (Completely Free) Here's the hidden gem: Unlimited session recordings, heatmaps, and AI-powered insights at zero cost. Integrates seamlessly with Google Analytics for behavioral context.
FullStory (Enterprise Pricing) The Rolls-Royce of session replay. Features "rage click" detection, frustration scoring, and error tracking. Companies using FullStory report finding 68% more conversion blockers than traditional analytics alone.
UserTesting ($1,500+/month) Get video recordings of real users navigating your site while thinking aloud. Moderated and unmoderated options available for different research needs.
Quantitative Analytics Tools: Measuring What Matters
This is where you track the hard metrics—conversions, revenue, user flows.
Google Analytics 4 (Free with paid 360 version) The undisputed champion of web analytics (hypernym). Tracks user journeys across websites and apps with built-in machine learning for predictive metrics. Processes over 1 trillion events daily across millions of properties.
Key features most people miss:
- Predictive audiences for churn prevention
- Cross-platform tracking without cookies
- BigQuery export for advanced analysis
- Enhanced e-commerce tracking
Adobe Analytics (Custom Enterprise Pricing) The Swiss Army knife for enterprise analytics. Real-time segmentation, attribution modeling, and anomaly detection powered by Adobe Sensei AI. Best for companies processing billions of hits monthly.
Matomo (Free open-source or $19/month cloud) The privacy-first alternative. 100% data ownership, GDPR-compliant by design, no data sampling. Used by the United Nations and European Commission.
Mixpanel ($25-$833/month) Product analytics specialist focusing on user engagement and retention. Track individual user journeys, not just pageviews. Mixpanel customers see 30% improvement in feature adoption rates.
Specialized Analytics Categories You're Probably Missing
Mobile App Analytics
- Firebase (Google, Free): Crash reporting, performance monitoring, A/B testing
- App Annie (now data.ai, $2,000+/month): Market intelligence and app performance
- AppsFlyer ($0.06/conversion): Attribution and deep linking for mobile marketing
Customer Journey Analytics
- Segment ($120/month+): Customer data platform (CDP) connecting 300+ tools
- Heap ($3,600/year+): Autocaptures everything—retroactively analyze without prior tracking
- Kissmetrics ($299/month+): Person-based analytics tracking individuals across devices
Real User Monitoring (RUM)
- New Relic ($25/month+): Application performance and user experience monitoring
- Datadog ($15/host/month): Infrastructure and application monitoring combined
- SpeedCurve ($20/month+): Performance analytics and competitive benchmarking
The Smart Selection Framework: Choosing Your Stack
Stop choosing tools based on features. Start with your needs:
For Startups (Under $1M Revenue) Start free: Google Analytics 4 + Microsoft Clarity + Google Search Console Total cost: $0/month with professional-grade insights
For Growing Businesses ($1M-$10M) Add depth: GA4 + Hotjar + Mixpanel or Amplitude Budget: $200-500/month for comprehensive coverage
For Enterprises ($10M+) Go custom: Adobe Analytics + FullStory + Segment + Custom BI tools Investment: $5,000-50,000/month depending on scale
Hidden Costs Nobody Talks About
The tool price is just the beginning.
Implementation Costs Professional setup runs $500-10,000 depending on complexity. DIY risks data quality issues costing more long-term.
Training Investment According to Gartner, companies spend 3-5% of analytics budget on training. Without it, you're using 20% of capabilities.
Integration Overhead Each tool connection requires maintenance. APIs change, tracking breaks, documentation needs updating.
Data Storage Processing millions of events? Budget for data warehouse costs—BigQuery, Snowflake, or Redshift add $100-10,000/month.
Where Does Digital Analytics Data Actually Come From?
Data flows from multiple tributaries:
Website Tracking Codes JavaScript snippets fire on every page load, button click, and form submission.
Mobile App SDKs Software development kits embedded in apps track user sessions, screen views, and in-app events.
Social Media APIs Platforms provide engagement metrics, audience demographics, and content performance data.
Email Marketing Platforms Track opens, clicks, conversions, and subscriber behavior patterns.
CRM Systems Customer relationship management tools contribute purchase history and support interactions.
What Are the Main Challenges in Digital Analytics?
Let's address the elephants in the room:
Data Quality and Integration Issues
Garbage in, garbage out. Inconsistent tracking, duplicate data, and siloed systems create incomplete pictures. Studies show 60% of companies struggle with data quality management.
Privacy Regulations and Compliance
The landscape keeps shifting. Cookie deprecation, iOS tracking changes, and evolving regulations require constant adaptation. GDPR violations can cost up to 4% of global revenue.
Attribution and Multi-touch Analysis
Which touchpoint gets credit? With customers using 6+ touchpoints before converting, attribution modeling becomes complex. Linear, time-decay, or data-driven models each tell different stories.
PRO Tips for Digital Analytics Success
Start Small, Scale Smart: Begin with basic metrics, then layer complexity as your team's expertise grows.
Create a Data Dictionary: Document what each metric means and how it's calculated—consistency is king.
Implement Regular Audits: Monthly tracking audits prevent data decay and catch issues early.
Focus on Actionable Metrics: If a metric doesn't inform decisions, stop tracking it.
Invest in Training: Your tools are only as good as the people using them—budget for ongoing education.